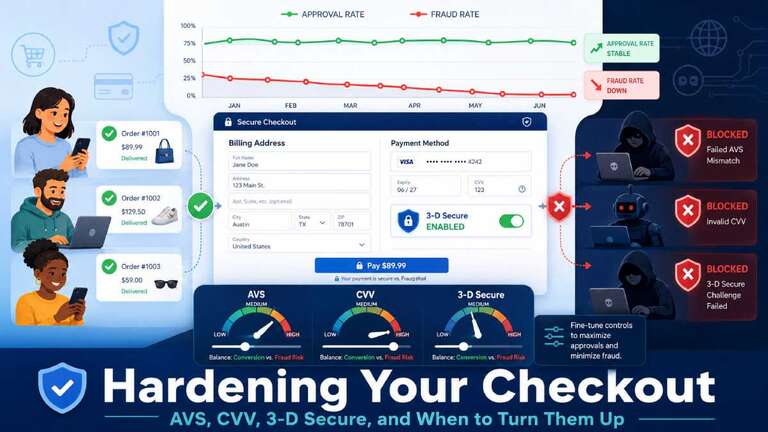

Hardening Your Checkout: AVS, CVV, 3‑D Secure, and When to Turn Them Up

When you “turn up” AVS, CVV, or 3‑D Secure, you’re really turning the dials between conversion, fraud loss, and chargeback/processor risk—not just “more security.” This post walks through how each control works, where it helps most, and how to be analytical about those trade‑offs instead of guessing.

Start with a simple measurement framework

Before you change any setting, decide how you’ll measure whether it helped or hurt.

For each checkout change, track at least:

  • Authorization rate – approved transactions ÷ attempts.
  • Checkout conversion – completed orders ÷ sessions that started checkout.
  • Fraud rate – confirmed fraud or fraud chargebacks ÷ approved transactions.
  • Chargeback ratio – chargebacks ÷ total transactions, especially card‑scheme ratios.

Then, when you tweak AVS/CVV/3DS, compare before/after windows (for example, 2–4 weeks) and by segment (country, device, product type) so you see where you’re helping or hurting.

AVS: address checks as a blunt but powerful filter

Address Verification Service (AVS) compares the billing address your customer enters to the address on file with the issuer. You typically get results like “full match”, “ZIP only”, “street only,” or “no match.”

Fraud teams like AVS because:

  • Stolen card data often does not include full, correct billing addresses.
  • “No match” responses correlate strongly with card‑not‑present fraud and carding attempts.

But it’s imperfect:

  • Legitimate customers move and forget to update their bank.
  • International AVS coverage is patchy, especially outside North America and the UK.

How hard should you lean on AVS?

Think of AVS as a slider, not a switch. You choose what happens on each result.

Common patterns:

  • Full match → auto‑approve (subject to other checks).
  • Partial match (ZIP only or street only) → approve but possibly route to higher 3DS risk or manual review on high‑value orders.
  • No match → decline outright on high‑risk segments (e.g., new customers, cross‑border, high‑ticket), or send to strong authentication.

Analytically, you want to:

  1. Measure fraud by AVS result.
    For a recent period, calculate fraud and chargeback rates separately for full match, partial match, and no match.
  2. Measure approval/conversion by AVS result.
    See how many legitimate approvals live in the “partial match” bucket, especially in countries where AVS is unreliable.
  3. Adjust rules where the gap is worst.
    For example, if “no match” has 10× the fraud rate of “full match” but only 1–2% of your approved volume, treating “no match” much more strictly likely improves your risk with little conversion impact.

In contrast, if “ZIP only” has only slightly higher fraud than “full match” but a big chunk of your international revenue, you probably don’t want to auto‑decline that entire bucket.

CVV: low friction, high value verification

The CVV is the 3–4 digit code printed on the card that is generally not stored in databases or on magnetic stripes. Because CVVs often aren’t present in large data breaches, a fraudster may have a card number without the correct CVV.

Requiring CVV:

  • Adds very little friction—customers are used to entering it.
  • Provides strong evidence that the cardholder physically has the card.
  • Reduces card‑not‑present fraud by making simple number‑only attacks harder.

Most guidance treats “always require CVV” as a baseline for CNP ecommerce.

When and how to “turn up” CVV

You have two main decision points:

  1. Always require CVV vs. sometimes skip
    • Always requiring CVV is recommended for standard ecommerce transactions because it provides extra protection and is widely supported.
    • Some merchants consider relaxing CVV for returning customers or subscription rebills to reduce friction, but this can open the door to account takeover abuse if logins are compromised.
  2. What to do with CVV mismatches
    • Many gateways let you choose whether to decline on mismatch, accept but flag, or send to review.
    • Since CVV responses are more reliable than AVS, mismatches are often treated as a strong fraud signal, especially combined with AVS failures or high‑risk geos.

Analytically:

  • Measure fraud and approval by CVV result (match vs mismatch vs not provided) over a few months.
  • If “mismatch” transactions show much higher fraud and very low genuine approval volume, you can justify auto‑declining them, at least for high‑risk segments.
  • If you choose to accept some mismatches, consider routing them to adaptive 3DS or manual review for higher amounts.

In practice, many merchants end up with a very strict CVV policy (“must match, otherwise fail or challenge”) and use AVS and 3DS as more nuanced levers.

3‑D Secure: big dial with big consequences

3‑D Secure (3DS) adds an extra authentication step—like approving in a banking app or entering a one‑time code—so the issuer can verify the cardholder before authorizing the transaction.

Properly used, 3DS:

  • Reduces certain types of card‑not‑present fraud, especially stolen card details abuse.
  • Shifts chargeback liability from merchant to issuer in many schemes, protecting your ratios.
  • Helps you stay below monitoring thresholds (such as the 0.3% chargeback ratio often cited in scheme programs).

But there are real trade‑offs:

  • Forcing 3DS on every transaction adds friction and can reduce approval and conversion rates if misconfigured.
  • Mobile implementations can be clunky in some markets, hurting cart completion.

Expert guidance now strongly favors adaptive or dynamic 3DS, where only higher‑risk transactions get challenged, while low‑risk ones pass without extra steps.

How to decide when to “turn up” 3‑D Secure

Instead of “3DS on everything” vs “3DS on nothing,” use these axes to decide when to challenge:

  • Risk signals – high AVS/CVV risk, unusual device, new account, IP or geo anomalies.
  • Ticket size – high‑value orders tolerate more friction; customers expect extra checks on expensive items.
  • Customer segment – new customers vs trusted repeat buyers; cross‑border vs domestic.
  • Fraud and chargeback posture – if you’re near scheme/program thresholds, 3DS becomes more valuable as a risk‑reduction tool.

Analytically, aim for:

  1. Baseline metrics without 3DS (or with current 3DS mix):
    • Fraud rate, chargeback ratio, approval rate, and checkout completion.
  2. Segmented tests where you “turn up” 3DS for a specific slice:
    • For example, only cross‑border orders over a certain amount, or only orders with AVS “no match.”
  3. Compare the unit economics:
    • How many additional orders did you lose from added friction?
    • How many fraud losses and chargeback fees did you avoid (plus softer benefits like staying under monitoring thresholds)?

Industry practitioners note that poorly configured 3DS can knock a few percentage points off approval or conversion, while good adaptive setups can cut fraud and chargebacks significantly with minimal impact on overall conversion.

Putting it together: a risk‑based checkout strategy

Once you understand each tool, you can combine them into a tiered decision engine that balances fraud vs conversion:

  • Low‑risk transactions (known customer, domestic, full AVS & CVV match, normal behavior)
    • Require CVV.
    • AVS result: full match.
    • 3DS: usually skip to keep the flow frictionless.
  • Medium‑risk transactions (new customer, partial AVS match, mid‑ticket)
    • Require CVV and decline outright on a mismatch in higher‑risk regions.
    • Allow some partial AVS matches but route them to adaptive 3DS rather than auto‑approve.
  • High‑risk transactions (no AVS match, strange IP/geo, high‑ticket, or you’re close to chargeback thresholds)
    • Require CVV and treat mismatches as hard fails.
    • Require 3DS challenge; consider declining if authentication fails or friction is refused.

Operationally, this gives you dials:

  • When fraud or chargebacks spike (for example, during a carding wave or campaign abuse), you tighten rules: more transactions flow to 3DS or get declined based on AVS/CVV.
  • When fraud is under control, and you’re missing revenue in a specific market or channel, you can relax specific segments: allow certain partial AVS matches or reduce 3DS challenges for trusted repeat customers, then watch conversion and fraud metrics.

How to iterate safely (lots of analytical examples)

To keep iterations safe and data‑driven:

  • Always A/B or time‑box changes.
    Apply new rules to a small subset of traffic or for a limited time, then compare against a control.
  • Evaluate changes with multi‑metric views.
    Look at authorization rate, conversion, fraud rate, and chargeback ratio together; a “win” is rarely visible in a single metric.
  • Drill down by segment.
    A rule may be great for domestic desktop traffic but terrible for cross‑border mobile; adjust by geography, device, and customer cohort.

Concrete ways to experiment:

  • AVS test: For a month, treat “no match” as auto‑decline for new customers in a high‑risk region and compare fraud/approval there to regions where you kept current rules.
  • CVV test: If you currently accept some “mismatch” results, start declining them for high‑value orders only and watch chargeback rates for those SKUs.
  • 3DS test: Turn on adaptive 3DS just for cross‑border orders over a threshold and measure how much fraud and chargebacks drop versus how much conversion moves in that slice.

Each of these gives you a measurable ROI story: “We added friction here, and here’s how much fraud/chargeback cost we avoided relative to the revenue we gave up.”

The bottom line

AVS, CVV, and 3‑D Secure are not just generic “security features”—they are adjustable levers in your checkout economics. The goal isn’t zero fraud at any cost; it’s an acceptable fraud and chargeback profile that keeps you safe with issuers and schemes while maximizing good customer conversion.

If you treat each control as a dial, measure the impact on approval, conversion, fraud, and chargebacks by segment, and iterate in small, analytical steps, you can harden your checkout intelligently instead of guessing and hoping.

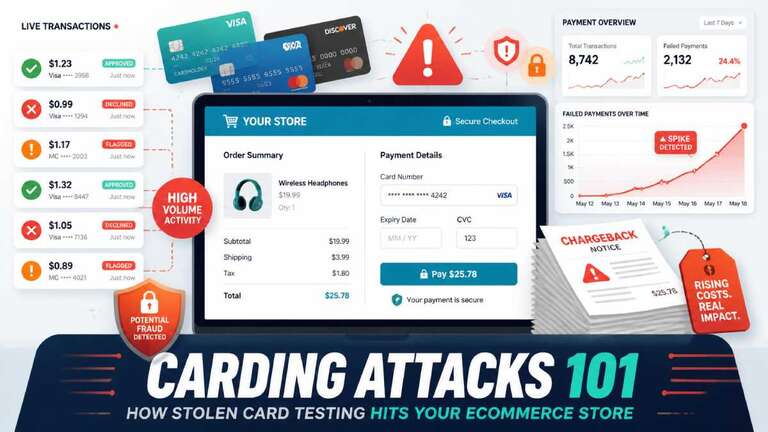
Carding Attacks 101: How Stolen Card Testing Hits Your Ecommerce Store

Carding attacks are one of the most common—and least understood—ways fraudsters abuse ecommerce checkout forms, quietly racking up fees, chargebacks, and reputational damage before anyone notices. This post walks through what carding looks like in practice, how it hits your payment processor relationship and chargebacks, and the first‑line defenses every store should have in place.

What a carding attack actually is

At its core, carding (or card testing) is the process of taking stolen card data and running small, automated transactions to find out which cards are still “alive.”

  • Fraudsters buy or harvest large batches of card numbers, expiry dates, and sometimes billing details from breaches or the dark web.
  • They then use bots or scripts to push those cards through your checkout or payment form—usually for very low‑value purchases—to see which ones authorize successfully.
  • Any card that works is added to a “validated” list that can be resold at a premium or used later for high‑value fraud (electronics, gift cards, resellable items).

Because the test transactions are tiny and spread across many merchants, they often fly under the radar—until chargebacks and processor warnings start rolling in.

What carding looks like in your ecommerce store

From your point of view, a carding attack doesn’t look like a Hollywood hack. It looks like “weird checkout behavior.”

Common symptoms include:

  • Spikes in failed or low‑value transactions
    You suddenly see lots of tiny orders (cents to a couple of dollars), many of which are declined or reversed.
    These often cluster in short time windows and off‑peak hours, without a matching rise in normal site traffic.
  • Rapid‑fire attempts from the same source
    Multiple payment attempts from the same IP, device fingerprint, or small IP range in minutes—not normal shopper behavior.
  • Odd billing data patterns
    Many transactions where ZIP, country, or address do not match card issuer records (AVS mismatches), or obviously fake names and emails.
  • Chargebacks and disputes on tiny charges
    Cardholders spot random “test” charges and dispute them, turning even low‑value tests into chargebacks for your business.

In more advanced attacks, carders pair card testing with credential stuffing—logging into real user accounts and then testing the saved cards on file, which can look even more like legitimate traffic at first glance.

How carding impacts your payment processor and chargebacks

Carding doesn’t just cost you a few dollars in fraudulent charges; it hits you at multiple layers of the payments ecosystem.

1. Direct financial costs per attempt and chargeback

  • Processors charge fees even on declines.
    A high‑volume carding run with thousands of declines generates gateway and network fees with zero revenue.
  • Successful tests become chargebacks.
    When cardholders dispute unauthorized test transactions, each chargeback hits you with a fee (often tens of dollars) plus the loss of the transaction amount.
    Industry analyses estimate that every dollar of fraud often costs merchants multiple dollars when you include chargebacks, fees, and operational overhead.

2. Chargeback ratios and monitoring programs

Payment schemes and acquirers closely monitor your chargeback ratio and other risk signals:

  • Carding attacks can generate a burst of disputes in a short period, pushing your chargeback ratio above thresholds that trigger fines and monitoring programs.
  • Visa’s updated VAMP (Visa Acquirer Monitoring Program) specifically calls out high‑volume card testing (“enumeration”) as a basis for penalties, including per‑chargeback fees if enumeration exceeds certain ratios.

If your chargeback and enumeration ratios stay elevated:

  • You may be reclassified as a high‑risk merchant, facing higher processing fees, rolling reserves, and stricter approval rules.
  • In extreme cases, processors can freeze funds or terminate your merchant account altogether, leaving you scrambling for a new (more expensive) provider.

3. Collateral damage to legitimate customers and revenue

Carding also hurts good customers:

  • Legitimate transactions may get declined more often as processors tighten risk rules or your own fraud tools become more aggressive in response.
  • Customers experiencing unexplained declines or seeing your store associated with card fraud lose trust and may not come back.

So even if the fraud amount itself looks “small,” the downstream impact on your payment’s reputation and customer experience can be huge.

First‑line defenses against carding attacks

Completely eliminating carding risk is impossible, but basic hardening will make your store a much less attractive target. Many carders simply move on to the next, easier merchant once friction and controls increase.

Think of defenses in three layers: checkout configuration, traffic and bot controls, and monitoring & operations.

1. Harden your checkout and payment configuration

These are “table stakes” settings you should review with your payment provider today:

  • Require AVS and CVV checks
    Turn on Address Verification Service (AVS) and make CVV mandatory. Carders often lack full billing details even if they have card numbers.
    Configure your gateway to decline mismatched AVS or CVV where appropriate for your market.
  • Use 3‑D Secure / SCA where available
    Implement schemes like Verified by Visa or Mastercard SecureCode that require an extra step (e.g., SMS code), shifting liability in many regions, and blocking many automated tests.
  • Set sensible minimum transaction amounts
    Because carding often uses very small test charges, setting a minimum order value just below your cheapest real product makes micro‑tests uneconomical.
    This is especially important for donation or “pay what you want” pages, which are a common target.
  • Limit or re‑think guest checkout in high‑risk flows
    Requiring an account for certain payment flows adds friction for bots and allows you to monitor behavior per user as well as per IP.

Work with your acquirer or gateway—they often have additional rulesets and tools (velocity checks, risk scoring, Radar‑style tools) that can be toggled or tuned for card testing scenarios.

2. Control automated traffic before it reaches payment

Since carding is heavily bot‑driven, controlling automated traffic is a primary defense.

Baseline controls include:

  • CAPTCHA or similar challenges on payment forms
    CAPTCHA on checkout or high‑risk payment endpoints can block many simple scripts and low‑effort bots while remaining tolerable for real users.
  • Rate limiting on payment attempts
    Enforce velocity limits such as:
    • Max X payment attempts per IP or account per minute/hour
    • Max Y declines per card before blocking further attempts
      Humans rarely attempt dozens of payments in quick succession; bots often do.
  • WAF and bot management in front of your store
    Web Application Firewalls (e.g., Cloudflare and similar services) can detect and throttle known botnets, suspicious user agents, and abusive IP ranges before traffic hits your app or gateway.
    Dedicated ecommerce security platforms analyze behavior patterns and fingerprints to distinguish real shoppers from sophisticated bots.
  • Geo and network‑based rules
    If you do not sell into certain high‑risk regions, consider blocking or challenging traffic from them, especially on checkout.

These controls dramatically reduce the number of test transactions that ever reach your payment provider.

3. Monitor, respond, and clean up quickly

Even with defenses, you should assume you’ll see some attempts—and treat them like incidents.

  • Monitor for early indicators
    Set alerts for:
    • Sudden spikes in declines or low‑value transactions
    • Unusual checkout activity outside normal traffic patterns
    • Clusters of attempts from the same IP, ASN, or device fingerprint
  • Respond fast when you spot carding
    Recommended steps from payment and security experts include:
    • Immediately notify your processor; they can help identify patterns and mitigate risk on their side.
    • Block or challenge suspicious IPs and routes using your WAF, bot tools, or firewall rules.
    • Temporary measures like disabling vulnerable “donation” or “name your price” products, and turning off saved‑card features if they’re being abused.
  • Refund suspicious successful transactions proactively
    Quickly reversing likely test charges reduces the chance they turn into chargebacks, which protects your ratios and reputation.
  • Review and update your rules after each incident
    Post‑attack, tighten fraud rules, update velocity thresholds, and adjust CAPTCHA or geo rules based on what you learned.

Bringing it all together

Carding attacks are appealing to criminals precisely because the damage is diffuse and delayed: lots of tiny, automated tests spread across many merchants, with the real hits—chargebacks, higher fees, stricter monitoring—showing up weeks later.

By recognizing what carding looks like in your own metrics, understanding the downstream impact on your processors and chargeback ratios, and putting solid first‑line defenses in place at checkout and at the edge, you dramatically reduce the odds that your store becomes an easy card‑testing playground.

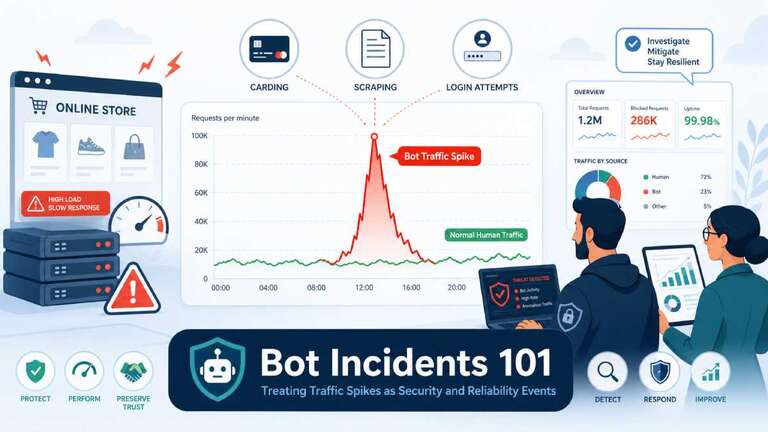
Bot Incidents 101: Treating Traffic Spikes as Security and Reliability Events

Bot traffic spikes shouldn’t just be treated as “weird analytics.” They are security incidents, reliability incidents, and sometimes quiet money leaks—all at once. In many ecommerce verticals, bots already make up a huge share of traffic, and they’re increasingly sophisticated, fast, and hard to distinguish from real shoppers.

Why bot spikes are not “just noise”

Several independent reports now estimate that bots account for 40–50% or more of ecommerce traffic, with some datasets showing bots actually outnumber human shoppers in peak seasons. Attack reports have documented triple‑digit growth in carding, scraping, and account takeover attempts over recent years, showing that automated abuse is climbing faster than organic traffic.

At the same time, analytics experts warn that bot sessions quietly corrupt every metric you rely on—traffic, engagement, conversion, and funnel performance—unless you actively filter them. Bot surges can make you think you have a growth or conversion problem when the real issue is that your reporting is lying to you.

Treating bot spikes as incidents forces you to ask three critical questions:

  • Security: Is this card testing, credential stuffing, scraping, or another attack?
  • Reliability: Is this traffic spike overloading our servers and slowing or breaking the site?
  • Analytics & marketing: Are we making decisions on polluted data, or even paying for fake clicks?

What a “bot incident” actually looks like

Bot activity is normal up to a point—you’ll always see good bots (search crawlers) plus some low‑level noise. A bot incident is when that activity changes suddenly in a way that threatens security, reliability, or data quality.

Common patterns include:

  • Sudden traffic spike that doesn’t match reality
    • Sessions or requests jump 2–10×, but orders don’t move in sync.
    • Spikes may concentrate on a few endpoints (search, PDPs, cart, specific APIs).
  • Weird geography, devices, or user agents
    • New “top country” that doesn’t match your market, often from data‑center IPs.
    • Unusual user agents, or too many different ones in a short period.
  • Strange behavior in analytics
    • Very short session durations (under a second), single‑page sessions, or bizarrely low/high bounce rates.
    • Conversion rate suddenly tanks—or appears to tank—because bots inflate sessions without buying.
  • Infrastructure and reliability symptoms
    • CPU and I/O spike, cache hit ratios drop, or backend services show elevated error rates and timeouts.
    • Real users start seeing slow pages or 5xx on search or checkout.

When those patterns appear together, you’re not just looking at noisy analytics—you’re in the middle of a bot incident.

The main types of ecommerce bot incidents

Reports on ecommerce bots generally group attacks into a few categories, each with its own signature.

1. Scraping and content harvesting storms

Scraper bots aggressively copy your product catalog, pricing, or content.

  • Impact:
    • Infrastructure: extra load on PDPs, category pages, and APIs.
    • Business: competitors can undercut prices or clone your catalog quickly.
    • Analytics: inflated pageviews and sessions with no conversions.

2. Carding and checkout abuse

Carding bots test stolen credit cards by running many small transactions through checkout.

  • Impact:
    • Security/fraud: chargebacks, fraud fines, and brand damage.
    • Reliability: spikes on checkout and payment endpoints, triggering timeouts or 5xx.
    • Analytics: lots of failed transactions, bogus “customers,” and distorted funnel numbers.

3. Credential stuffing and account takeover

Bots reuse leaked usernames/passwords to break into customer accounts.

  • Impact:
    • Security: account takeovers, fraudulent orders, loyalty point theft.
    • Reliability: login endpoints hammered, rate limits kicked in, some users locked out.
    • Analytics: login error spikes, strange login geos, and weird session patterns.

4. Inventory hoarding and scalping

Bots hold or buy up limited stock (tickets, consoles, drops) faster than humans can click.

  • Impact:
    • Revenue/brand: real customers can’t buy, blame you for unfair drops, and churn.
    • Analytics: product pages show huge interest but poor legitimate conversion.
    • Security: ties to resale markets and organized abuse.

5. AI and crawler overload

AI crawlers and aggressive SEO bots hit content and APIs more frequently, sometimes overwhelming caches and backends.

  • Impact:
    • Reliability: increased CPU, I/O, and bandwidth lead to slower responses for real users.
    • Analytics: your “traffic growth” is mostly bots, not humans.
    • Costs: higher infra bills with no matching revenue.

Why bot spikes are both security and reliability events

The key mindset shift: bot incidents sit at the intersection of security, reliability, and analytics.

  • Security
    • Carding, credential stuffing, and account takeover are clearly abuses.
    • Even “just” scraping can expose pricing strategies, aggregated PII, or proprietary structures.
  • Reliability / performance
    • Bots can trigger what some call an “I/O death spiral”: they consume CPU and I/O until real users see >5s load times and start bouncing.
    • Cache and database systems are especially vulnerable to sustained bot load.
  • Analytics & marketing
    • Bot sessions massively inflate traffic, distort engagement metrics, and drag down apparent conversion, leading to bad decisions.
    • Ad platforms may charge you for fake clicks, polluting audiences and campaigns.

If you only treat bots as a “security thing,” you’ll miss the performance and revenue angle. If you only see them as “analytics noise,” you’ll miss the fraud and abuse risks.

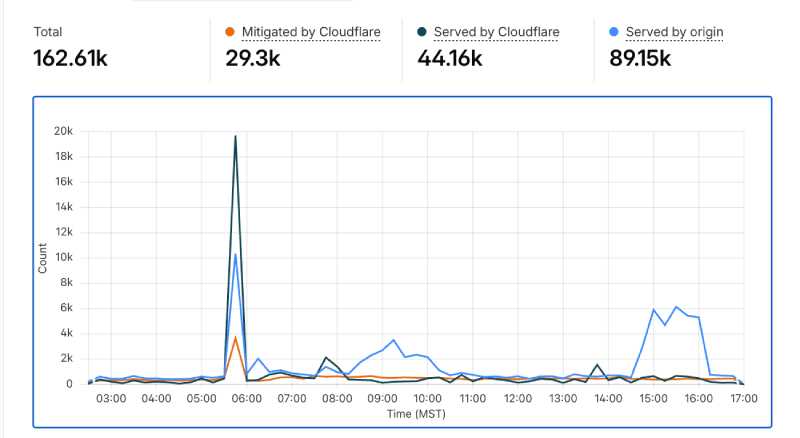
Cloudflare analytics spikes

Detecting bot incidents early: what to monitor

Bot detection tools and WAFs help, but you still need to design what you watch for. Practical indicators include:

  • Traffic and behavior metrics
    • Sessions or requests per minute by route, segmented by suspected bot vs human.
    • Session duration & pages/session anomalies: very short or oddly uniform patterns.
    • Conversion rate with and without suspected bot traffic.
  • Source & infrastructure signals
    • Geos and ASNs (data‑center IP ranges, unexpected countries jump to the top).
    • User agent fingerprints (toolkits, headless browsers, rotated UAs).
    • CPU, memory, and I/O spikes on web/app servers aligned with unusual traffic patterns.
  • Security‑specific events
    • Login failure bursts, password reset spikes, or unusual 401/403 patterns.
    • Surge in failed payment attempts with small values or identical SKUs.

Many teams build dashboards that overlay traffic volume, error rates, latency, and conversion so bot incidents pop out visually rather than being buried in separate tools.

Treating bot spikes as incidents: a simple lifecycle

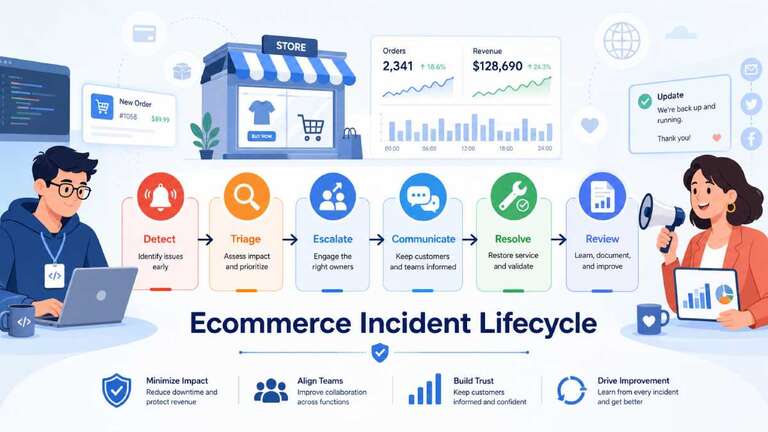
You can apply a standard incident lifecycle—detect → triage → escalate → communicate → resolve → review—to bots just like any other outage.

1) Detect and declare

When you see the patterns above, declare a bot incident rather than quietly tweaking filters.

  • Create an incident record with time, routes affected, suspected bot type, and early impact.
  • Include analytics screenshots: traffic spike, conversion drop, or error/latency graphs.

2) Triage: what kind of bot and how bad?

Ask:

  • Is this clearly malicious (carding, credential stuffing) or “just” abusive scraping?
  • Are real users slowed down, getting errors, or blocked?
  • Are we wasting ad spend or corrupting audiences?

Set severity based on:

  • Security risk (fraud, account takeover, compliance issues).
  • Performance impact (p95 latency, 5xx on key routes).
  • Business impact (conversion/revenue drop, ad budgets on).

3) Escalate: bring in security, ops, and marketing

Bot incidents often require a cross‑functional response:

  • Security/fraud – lead on classifying the attack and long‑term mitigation.
  • Ops/engineering – protect infrastructure, adjust rate limits, tune WAF, and caching.
  • Analytics/marketing – filter bots from reports, adjust campaigns, and protect ROAS.

Paging and incident‑response tools (PagerDuty, etc.) are useful here because you can define bot‑related alert rules and escalation paths just like for other production incidents.

4) Communicate: internally and sometimes externally

Internal comms:

  • Brief leadership and marketing: “We are seeing a bot attack affecting X routes; real users are currently Y% impacted; here’s what we’re doing.”
  • Coordinate with support so they know what to tell customers.

External comms (for severe cases):

  • If real customers can’t log in or check out, treat it like any other outage: short status updates, possible banners, and reassurance that fraud is being addressed.

5) Resolve: contain first, then clean up

Mitigation tactics depend on incident type, but common steps include:

  • Tightening WAF and bot rules, especially on search, PDPs, and checkout.
  • Adding or adjusting rate limits on critical endpoints.
  • Blocking or challenging certain IPs, ASNs, or geos temporarily (with caution).
  • Adjusting analytics filters and GA4 bot filters/segments so that reporting is usable again.

As a Reddit ecommerce discussion notes, a combination of good WAF/bot protection (for example, via Cloudflare), targeted rate limiting, and filtered analytics usually gives the fastest relief.

6) Review: learn, quantify, and harden

After a bot incident, do a short postmortem:

  • How much real traffic and revenue were impacted?
  • How much ad spend went to bots?
  • Which controls worked, and which didn’t?
  • What SLOs or alerts should we add or tighten (for example, bot‑filtered conversion SLOs)?

Update runbooks with concrete playbooks: “If we see pattern X on route Y, apply mitigation Z.”

Long‑term defenses: from one‑off incidents to durable posture

Bot‑incident handling gets easier when you invest in prevention and observability up front.

Key longer‑term steps:

  • Deploy robust bot detection/WAF tooling that can distinguish good bots, bad bots, and humans, and adapt as attacks change.
  • Segment and filter analytics so every dashboard has a “human only” view.
  • Set SLOs and alerts that account for bots, such as conversion stability excluding suspected bots, and latency/error SLOs on key routes even under noisy conditions.
  • Coordinate with marketing to monitor bot impact on ad clicks, pixels, and audience building.

When you treat bot spikes as first‑class incidents—complete with detection, triage, escalation, communication, resolution, and review—you stop seeing them as background noise and start treating them as what they are: security and reliability events that can quietly erode your margin, your data, and your customers’ trust.

Incident Lifecycle for Ecommerce: From Alert to Postmortem

An incident lifecycle is the difference between “panic in Slack” and a calm, repeatable way to protect your ecommerce revenue when something breaks. A good process gives everyone—from on‑call devs to marketers and store owners—a script to follow: detect → triage → escalate → communicate → resolve → review.

This post walks through that lifecycle, with concrete roles and responsibilities so any ecommerce team can use it as a playbook.

Why ecommerce needs a defined incident lifecycle

Incident management guides all say the same thing: if you don’t define how you respond before trouble hits, you lose precious minutes improvising during an outage. For online stores, those minutes are active carts, ad clicks, and checkout attempts.

Best‑practice frameworks (ITIL, SRE, PagerDuty, Atlassian) all describe similar stages—detect/log, classify/triage, assign/escalate, investigate, resolve, and review. The trick for ecommerce is mapping those stages to:

  • Store owners / ecommerce managers – responsible for revenue, customer promises, and priorities.
  • Developers / ops / SRE – fix the technical problem.
  • Marketers / comms / support – shape customer communication, campaigns, and expectations.

Let’s walk the lifecycle.

Stage 1: Detect – knowing something broke before your customers tell you

In most incident frameworks, the lifecycle starts with detection and logging—monitoring tools or humans notice something wrong and create an incident record.

For ecommerce, incidents are often detected through:

  • Automated monitoring – uptime checks, observability dashboards, and alerts when error rates or latency cross thresholds on PDP, cart, checkout, or payment APIs.
  • Customer or support reports – tickets, live chat, or social media complaints (“Can’t checkout”, “Payment failed”, “Site is super slow”).
  • Internal discovery – marketers spotting weird conversion drops, analysts noticing funnel anomalies, or engineers seeing anomalies during routine work.

Best practice is to aim for automated detection before customers notice, minimizing the gap between incident start and detection (Time to Detect).

Who does what at Detect

  • Monitoring/ops/dev: Maintain alerts for key ecommerce signals (checkout 5xx, payment failures, latency, synthetic checkout journeys) and ensure they create incidents automatically in your tool (PagerDuty, OpsGenie, etc.).
  • Support / social / marketing: Escalate unusual patterns (many complaints, conversion crash) into the same incident system—not just a pinned Slack message.
  • Store owner / ecommerce manager: Define what counts as an “incident” vs a minor bug, so people aren’t afraid to declare one.

Stage 2: Triage – how bad is it, and who needs to jump in?

After detection, guidance from Atlassian, PagerDuty, and others is clear: categorize, prioritize, and assign severity.

For ecommerce, triage answers:

  • Impact – which users, regions, and journeys are affected (checkout only? mobile only? all traffic?).
  • Urgency – is this growing quickly or stable? Is there a simple workaround?
  • Severity level (SEV1–SEV3) – based on business impact:
    • SEV1: Checkout down, critical payment method failing, or major security issue.
    • SEV2: Some users or regions affected, or serious performance issues.
    • SEV3: Minor feature or cosmetic issues, low immediate revenue impact.

Incident management references emphasize that consistent severity definitions help route incidents and avoid decision paralysis.

Who does what at Triage

  • Incident commander / on‑call dev or ops (you should designate this role):
    • Quickly review metrics and logs to estimate scope and impact.
    • Set the severity level and confirm “yes, this is an incident.”
  • Store owner / ecommerce manager:
    • Provide context: current campaigns, sales events, or VIP customers likely affected, which may bump severity up.
  • Data / analytics / marketing:
    • Provide early data on conversion impact (“Checkout completion just dropped by 70% in the last 10 minutes”).

Stage 3: Escalate – get the right people in the room, fast

Once severity is set, most incident frameworks recommend assignment and escalation: notify the right responders, and bring in more help based on severity.

For ecommerce, that usually means:

  • Technical responders – on‑call engineer for the affected service (web, backend, payment integration, database, etc.).
  • Incident commander – coordinates, decides, and keeps people focused; often the primary on‑call or a senior engineer.
  • Communications owner – handles updates to internal stakeholders and customers.
  • Business/marketing rep – makes calls on pausing campaigns, adjusting promotions, or updating banners.

PagerDuty and similar tools describe this stage as mobilize: assembling the right team based on severity and type of incident.

Who does what at Escalate

  • On‑call / incident commander:
    • Trigger the incident in your tool (PagerDuty, etc.), page the right responders, and spin up an incident channel (Slack/Teams) and optionally a Zoom/Meet bridge.
  • Technical leads / SMEs:
    • Join quickly, declare when they’re taking specific investigative tasks, and escalate further if needed (DBA, security, networking).
  • Store owner / marketing:
    • Join as observers/decision‑makers, not extra troubleshooters—focus on customer impact and business decisions instead of poking logs.

Stage 4: Communicate – keep customers and stakeholders informed

Every serious incident guide stresses communication as a separate, intentional practice—not an afterthought. For ecommerce, communication failures can cost as much as the technical failure itself: confused customers, angry social posts, and internal chaos.

Best‑practice communication guidance includes:

  • Have a designated spokesperson / comms owner so updates are consistent.
  • Be transparent and empathetic about impact and progress.
  • Give timely, regular updates rather than silence or vague reassurances.
  • Use multiple channels—status page, in‑app banners, email for major incidents, social for widespread issues.
  • Tailor messages for different audiences (customers vs leadership vs support teams).

For ecommerce outages (checkout broken, payments failing, performance meltdown), a good pattern is:

  1. Internal update within minutes: what’s impacted, who’s on it, when the next update is.
  2. External status update if SEV1/SEV2: short, clear message on a status page or banner, with promised update cadence.
  3. Regular internal + external updates until resolution, then a final “resolved” note with next steps.

Who does what at Communicate

  • Comms lead / marketing / CX:
    • Own all external words: status page, banners, emails, social posts.
    • Stick to consistent messaging and timelines.
  • Incident commander:
    • Own internal updates in the incident channel and summary messages to leadership.
  • Store owner:
    • Decide on customer‑facing concessions (extended sale duration, coupons, free shipping) and internal thresholds for notifying top customers.

Stage 5: Resolve – mitigate first, perfect later

Incident response frameworks emphasize a key principle: mitigation and containment come before full root cause analysis. For an ecommerce store, “resolve” means:

  • Stop or reduce customer impact as fast as possible (rollback, failover, feature flag).
  • Then restore normal operations in a controlled way.
  • Then monitor to ensure the issue doesn’t recur immediately.

Typical ecommerce mitigation patterns:

  • Roll back the deployment that broke checkout or slowed the site.
  • Fail over to a backup payment gateway or region if the primary provider is down.
  • Rate‑limit or block bot traffic if a flood is overloading search or checkout.
  • Temporarily disable non‑essential features (heavy personalization, recommendations, experiments) to reduce load on critical paths.

PagerDuty and Atlassian both stress that the incident is “over” when customer impact ends—even if you’re still running on a temporary workaround.

Who does what at Resolve

  • Technical responders:
    • Execute changes (rollbacks, config flips, WAF rules), verify via dashboards that errors and latency return to normal, and monitor for relapse.
  • Incident commander:
    • Decide when to declare the incident mitigated or resolved; coordinate any staged rollouts.
  • Marketing / store owner:
    • Decide when to resume paused campaigns or promotions, and whether to extend offers to make up for downtime.

Stage 6: Review – postmortem and improvement, not blame

The final stage in most incident lifecycles is closure and review, often via a blameless postmortem. This is where you turn an expensive mistake into a concrete reliability and conversion improvement.

Incident review best practices include:

  • Schedule a short review soon after the incident (while details are fresh).
  • Use a structured document: summary, impact, timeline, root cause, what worked, what didn’t, and action items.
  • Focus on systems and processes, not individual blame.
  • Capture learnings in a place others will actually find and read.

For ecommerce, add a business and marketing lens:

  • How many sessions, orders, and how much revenue were impacted (even approximately)?
  • Which campaigns were running at the time, and how did they amplify the impact?
  • Which SLOs were breached (checkout availability, latency, conversion stability)?
  • What changes will prevent or soften this type of incident next time (extra monitoring, redundant providers, better bot protection)?

Who does what at Review

  • Incident commander / technical lead:
    • Draft the core postmortem (timeline, technical root cause, technical actions).
  • Store owner / marketing / analytics:
    • Fill in business impact and conversion metrics, plus any customer‑facing cleanup (refunds, follow‑up messages, extended sales).
  • All participants:
    • Agree on 3–7 prioritized action items with owners and dates (for example, new alerts, new runbooks, backup integrations).

Putting it together: a simple ecommerce incident lifecycle you can adopt

You can summarize the process in a compact checklist for your own runbook:

  1. Detect
    • Monitoring or humans spot an issue.
    • Create an incident ticket with initial details (what’s broken, where, since when).
  2. Triage
    • Estimate scope and user impact.
    • Set severity (SEV1–SEV3) and decide if this is truly an incident.
  3. Escalate
    • Page on‑call technical responders and incident commander via your tool (PagerDuty, etc.).
    • Add comms/marketing rep for SEV1/SEV2.
  4. Communicate
    • Provide clear internal updates; publish external status if needed.
    • Keep messages honest, consistent, and audience‑appropriate.
  5. Resolve
    • Mitigate impact quickly (rollback, failover, block bots).
    • Then stabilize and verify via dashboards and logs.
  6. Review
    • Run a short, blameless postmortem.
    • Document technical and business impact, decide actions, and track them to completion.

If you give each stage an owner and write this down where everyone can find it, you’ve effectively built an incident management system that any ecommerce team—no matter how small—can use to handle outages with less chaos and more learning.

SLOs for Ecommerce: Defining “Good Enough” Uptime, Speed, and Error Rates

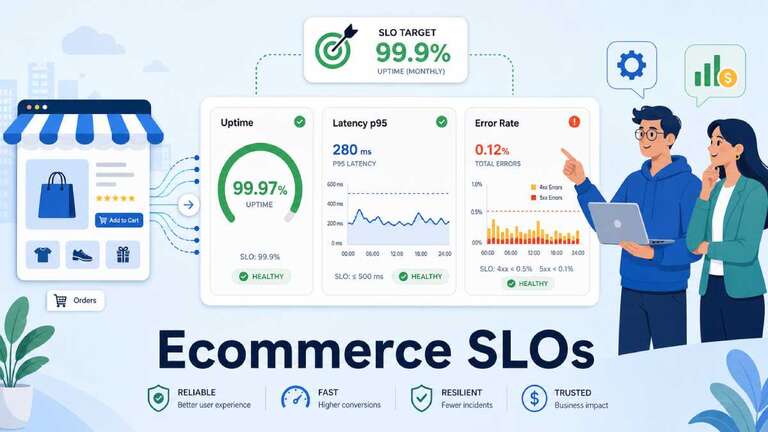
“SLOs” are how you define what “good enough” means for your ecommerce site—before something breaks, not after. In practice, they turn vague goals like “keep checkout fast” into concrete targets for uptime, speed, and error rates that everyone (tech, marketing, leadership) can align on.

What SLOs are (and why ecommerce needs them)

In reliability engineering, three terms come together:

  • SLI (Service Level Indicator) – a measurable metric, like checkout success rate, p95 checkout latency, or 5xx rate.
  • SLO (Service Level Objective) – the target you want that SLI to meet over a time window (for example, “99.9% of checkouts succeed each month”).
  • SLA (Service Level Agreement) – a contractual promise with customers; often legal/financial, and built on top of SLOs.

For ecommerce, SLOs matter because:

  • Conversion is fragile. Studies consistently show that slower pages and higher error rates cut conversion and revenue.
  • Not all pages are equal. A brief issue on a blog post is annoying; the same issue on checkout is expensive.
  • Teams need a shared language. SLOs give ops, dev, and marketing a common way to talk about “how healthy is the store?”

Instead of “the site seems slow,” you can say “checkout p95 latency exceeded our SLO yesterday, and conversion dropped.”

Step 1: Choose SLIs that actually matter for ecommerce

Observability guides recommend starting from business requirements, then choosing SLIs that represent user experience on key journeys.

For an online store, focus on four areas:

  1. Availability / uptime by page type
    • SLIs:
      • % of successful requests (non‑4xx/5xx) for home, PDP, cart, checkout.
      • “End‑to‑end” synthetic checks for full checkout journeys (home → PDP → cart → checkout → payment).
  2. Latency / speed
    • SLIs:
      • p95 response time for PDP, cart, and checkout routes.
      • Real‑user Web Vitals (LCP, INP) on critical pages
  3. Error rates
    • SLIs:
      • 4xx and 5xx error rate per key route, especially /checkout and payment APIs.
      • % of failed payment attempts vs successful ones.
  4. Business / funnel health
    • SLIs:
      • Cart → checkout conversion rate.
      • Checkout → purchase conversion rate.
      • Revenue per session, split by device.

You don’t need dozens of SLIs—start with 1–2 per critical journey and refine later.

Step 2: Decide which journeys deserve the strictest SLOs

Not every part of your site needs “four nines.” Observability best‑practice guides stress that reliability targets should match user expectations and business value.

For ecommerce, think in tiers:

  • Tier 1: Checkout and payment
    • Highest expectations. Outages directly translate to lost orders and wasted ad spend.
  • Tier 2: Cart, PDPs, search
    • Very important for conversion, but a brief glitch may be less catastrophic than payment failure.
  • Tier 3: Content, blog, admin, reports
    • Still need to work, but you can accept more lenient SLOs.

Example “strictness”:

  • Checkout availability SLO: 99.9% monthly (≤ ~43 minutes of “down” time per month).
  • PDP availability SLO: 99.5% monthly.
  • Blog availability SLO: 99% monthly.

This keeps you focused on the pages that move revenue first.

Step 3: Define “good enough” uptime, speed, and error rates

Availability SLOs

A common availability SLI is the fraction of successful requests, based on HTTP status codes:

availability=total requests(4xx+5xx)total requestsavailability = \frac{\text{total requests} – (4xx + 5xx)}{\text{total requests}}

For ecommerce:

  • Checkout:
    • SLO example: “At least 99.9% of checkout and payment requests succeed each calendar month.”
  • PDPs / PLPs:
    • SLO example: “At least 99.7% of product and category page requests succeed each month.”

Latency / speed SLOs

Average latency hides the worst experiences. Observability practices emphasize using p95 or p99 to capture tail latency.

For example:

  • Checkout p95 SLO: “95% of checkout page loads complete in under 2.5 seconds server time, and under 3.5 seconds LCP for real users on mobile.”
  • PDP p95 SLO: “95% of product page responses are under 1 second on the backend.”

These thresholds should be informed by user behavior: research shows that just a 100ms delay can measurably reduce conversion, while multi‑second delays significantly hurt revenue.

Error rate SLOs

You can define error SLOs as:

  • “5xx errors on /checkout remain below 0.5% of requests over any 30‑minute window.”
  • “Payment failure rate (excluding user declines) stays below 1% daily.”

For funnels:

  • “Checkout→purchase conversion stays within ±X% of the 30‑day baseline, excluding bot traffic.”

That last one is powerful because it gives marketing a reliability expectation too: if conversion suddenly drops outside the SLO, something needs investigation—even if error rates look OK.

Step 4: Add error budgets so you know when to stop shipping and start fixing

SLOs are targets; error budgets are how much you’re allowed to miss them before you must change behavior.

For example:

  • Checkout availability SLO: 99.9% per month → error budget = 0.1% “unreliability.”
  • If you blow half the budget in a week (for example, a 30‑minute outage), you pause risky releases that affect checkout until reliability is back on track.

This approach, popular in SRE, helps balance:

  • Marketing/product pressure to ship features fast.
  • Ops pressure to keep the system stable.

For ecommerce, you can define budgets on:

  • Checkout uptime.
  • Checkout p95 latency.
  • Payment failure rates.

When a budget is “burning too fast,” you prioritize reliability work that has a direct conversion impact.

Step 5: Tie SLOs directly to dashboards and alerts

SLOs are only useful if you can see and alert on them.

For each SLO:

  1. Build a dashboard tile that shows:
    • Current value (for example, checkout p95 latency).
    • SLO target line (for example, 2.5s).
    • Historical trend (7/30 days).
  2. Set alerts on SLO symptoms, not just low‑level metrics:
    • If 5xx on checkout > 1% over 5–10 minutes → alert.
    • If checkout p95 latency > SLO threshold for N minutes → alert.
    • If checkout conversion drops more than X% vs baseline (after filtering bots) → alert both ops and marketing.
  3. Make the alert actionable: include which route is affected, recent deploys, and links to dashboards.

This is where your “Ecommerce Observability Stack” and SLOs join up: SLOs define the target; observability shows whether you’re meeting it, in both technical and business terms.

Step 6: Include marketing and business metrics in SLO reviews

Most SLO discussions stay inside engineering. For ecommerce, they should include:

  • Conversion rates by step (PDP→Cart, Cart→Checkout, Checkout→Purchase).
  • Revenue per session and per channel.
  • Impacted campaigns when SLOs are breached (for example, “Meta campaign X ran during a checkout availability breach”).

A simple monthly review agenda:

  • Which SLOs were met or missed?
  • Where did we burn error budget (outages, slowdowns)?
  • How did those align with conversion changes and campaigns?
  • What are the top 3 fixes or investments for next month?

This keeps SLOs from becoming a purely technical exercise; they become a shared tool for protecting revenue and customer experience.

Concrete “starter” SLO set for a typical ecommerce site

You can offer this as a ready‑to‑copy set in your post:

  1. Checkout availability
    • SLI: % of checkout and payment requests returning non‑4xx/5xx.
    • SLO: ≥ 99.9% per month.
  2. Checkout speed (mobile)
    • SLI: p95 LCP on checkout page for mobile real users.
    • SLO: ≤ 3.5 seconds over rolling 7 days.
  3. Payment error rate
    • SLI: % of payment attempts failing for non‑user reasons (gateway errors/timeouts).
    • SLO: ≤ 1% daily.
  4. PDP speed
    • SLI: p95 backend latency on PDP routes.
    • SLO: ≤ 1 second over rolling 7 days.
  5. Checkout conversion stability
    • SLI: Checkout→Purchase conversion, bot‑filtered.
    • SLO: Stays within ±X% of 30‑day moving average (outside this range triggers investigation).

That’s enough to get a serious SLO program going without drowning in metrics.

Final thought

For ecommerce, “good enough” isn’t an abstract number—it’s the combination of uptime, speed, and error rates that still delivers the conversion and revenue you expect. SLOs give you a way to define that line, see when you cross it, and choose when to slow down releases and invest in reliability.

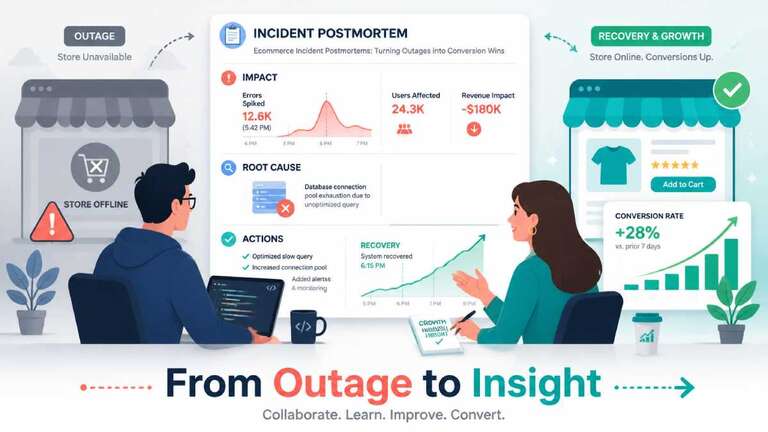
Ecommerce Incident Postmortems: Turning Outages into Conversion Wins

Incident postmortems can turn painful ecommerce outages into concrete conversion wins—if you write them in a way that connects technical root causes to customer impact and revenue, not just “what went wrong on the server.”

Below is a blog‑style guide you can publish or adapt.

Why ecommerce teams need postmortems (not just “error logs”)

When checkout breaks, a payment gateway goes down, or bots flood your store, you don’t just lose uptime—you lose orders, ad spend, and trust.

Good incident postmortems help you:

  • Quantify what happened in terms of customers and revenue, not just CPU and status codes.
  • Find the systemic causes behind the incident, not just the last failing component.
  • Prioritize fixes that reduce future incidents and improve conversion rates (for example, fallback gateways, better observability, and bot defenses).

Most templates from SRE and SaaS can work for ecommerce, but you need to explicitly add marketing and conversion‑focused sections.

A simple ecommerce incident postmortem template

You want something short enough that people will actually fill it in, but rich enough to drive changes.

You can use this 7‑section structure:

  1. Summary – 2–3 sentences, customer‑impact first.
  2. Impact (technical + business) – who was affected, for how long, and rough revenue impact.
  3. Timeline – key events from detection to resolution.
  4. Root cause – what failed and why, using a simple “5 Whys” or similar.
  5. Detection & response – how it was detected, how fast you reacted, and what slowed you down.
  6. What went well / what didn’t – honest, blameless reflection.
  7. Action items – 3–7 concrete changes with owners and dates.

This mirrors modern “blameless postmortem” templates, but we’ll layer in ecommerce‑specific details like conversion rate changes, affected campaigns, and bot/traffic quality.

1) Summary: start with the customer experience

Bad summary: “Stripe API timeout errors between 14:20 and 15:00 UTC.”

Good ecommerce summary:

“For 40 minutes, most shoppers could not complete card payments at checkout, causing a ~90% drop in completed orders during a live promotion.”

Guidelines:

  • 1–3 sentences max.
  • Describe what users experienced (errors, slowness, blocked action).
  • Mention duration and affected area (checkout, account login, PDPs).
  • Optional: high‑level revenue impact (for example, “estimated $X in lost orders”).

2) Impact: show both the system and revenue

Take inspiration from incident templates that ask for “Who was impacted” and “Revenue at risk.”

For ecommerce, include:

  • Technical:
    • Affected routes or services (for example, POST /checkout, payment API).
    • Error rates (5xx, 4xx), timeouts, or latency spikes.
  • Customer:
    • % of sessions unable to complete checkout or login.
    • Devices or regions affected (for example, mobile only, EU only).
  • Business:
    • Estimated lost orders: sessions × typical conversion × AOV × outage duration.
    • Impact on active campaigns (for example, “affected traffic from Meta/Google search ads during sale period”).

Example language:

  • 2,300 sessions reached checkout during the 45‑minute window.
  • Checkout completion rate dropped from 2.8% to 0.3%, for an estimated 50–60 lost orders.
  • With an AOV of $80, we estimate ~$4,000 in direct lost revenue, not counting repeat customers who never got to buy.

Even approximate numbers are better than “unknown,” and calculators for downtime losses can help estimate impact.

3) Timeline: keep it factual and short

Most SRE templates recommend a UTC timeline with key events only.

For ecommerce, log:

  • Detection (monitoring alert, customer reports, marketing noticing conversion drop).
  • Confirmation (dashboards/logs prove issue).
  • Mitigation attempts (rollbacks, feature flags, traffic steering).
  • Resolution (issue fixed, traffic back to normal).
  • Post‑incident communication (status page, internal announcements).

Example:

  • 14:22 – Stripe 5xx error rate jumps from <0.1% to 40% on POST /payment.
  • 14:25 – Conversion dashboard shows checkout completions down 85% vs prior 15 minutes.
  • 14:28 – On‑call engineer acknowledges alert in Slack, pauses paid campaigns.
  • 14:33 – Payment traffic rerouted to backup gateway.
  • 14:40 – Checkout success rate back to baseline; campaigns cautiously resumed.

4) Root cause: go beyond “the gateway was down”

Use a brief “5 Whys” to find the systemic cause.

For ecommerce incidents, systemic causes often include:

  • No fallback payment gateway or routing.
  • No alerts targeting checkout specifically (only generic uptime checks).
  • Bot protections are misconfigured, blocking humans or overloading systems.
  • Performance regressions on mobile were not tested before release.

Example chain for a broken payment method:

  1. Why did customers see a payment failed?
    → The primary gateway’s API started returning 5xx errors.
  2. Why did that stop almost all orders?
    → We had no backup payment route configured; all traffic used the failing gateway.
  3. Why did we not detect it quickly?
    → We monitored general uptime but not checkout error rate or gateway status.
  4. Why did we not have checkout‑specific monitoring?
    → Monitoring was set up around infrastructure metrics, not conversion or route‑level health.

Systemic cause (one sentence):

“We relied on a single payment gateway, with no health‑based routing or checkout‑specific monitoring, so a partner outage instantly translated into a checkout outage and lost sales.”

5) Detection & response: measure how fast you caught it

Modern postmortem templates highlight Time to Detect (TTD), Time to Mitigate (TTM), and Time to Resolve (TTR).

For ecommerce, detection shouldn’t only come from ops alerts; it should also come from:

  • Observability dashboards (checkout error/latency spikes).
  • Funnel analytics (sudden drop in Checkout→Purchase).
  • Bot and traffic monitoring (unusual bot spikes during campaigns).

Questions to answer:

  • Did an alert fire? Was it actionable or noisy?
  • Did marketing or customer support notice conversion issues first?
  • Did we have a runbook for payment/bot/checkout incidents?

This section helps you decide which alerts, dashboards, and runbooks to improve.

6) What went well / what didn’t (blameless)

Borrow from blameless postmortem practices:

Example “what went well”:

  • On‑call responded within 5 minutes of alert.
  • Marketing quickly paused paid campaigns to avoid wasting budget on a broken funnel.
  • Existing dashboards made it easy to confirm checkout failure, not just guess.

Example “what didn’t”:

  • No automatic fallback to a secondary payment provider, increasing downtime.
  • No alert on spike in checkout failures; we noticed only when marketing reported “sales look weird.”
  • Incident updates did not reach customer support until 20+ minutes in, leading to inconsistent messaging to customers.

Keep this section focused on systems and processes, not individuals.

7) Action items: tie fixes to conversion and revenue

Postmortems only matter if they produce 3–7 high‑impact changes with owners and dates, not a long wish list.

For ecommerce incidents, you’re looking for actions like:

  • Add secondary payment gateways and routing based on gateway health and status pages.
  • Add checkout‑specific alerts: spike in 5xx or failed payments, drop in Checkout→Purchase conversion, p95 latency on /checkout above threshold.
  • Improve bot detection and WAF rules to reduce fraudulent/bot traffic without hurting real customers.
  • Add mobile performance tests and budgets for checkout so slow releases are caught before going live.

Each action item should answer:

  • What will change (monitoring, code, infra, process)?
  • Who owns it?
  • When will it be done?
  • How will we measure success (for example, “no single‑gateway outage should drop completed checkouts by more than X%”).

Example 1: Broken payment method during a sale

Scenario: Your only credit card gateway has a 90‑minute outage during a flash sale, causing a 90% drop in successful checkouts.

In the postmortem, make sure you include:

  • Impact:
    • Checkout error rate and conversion drop with rough lost revenue estimate.
    • Campaigns affected (for example, “Google Ads + Meta spend during the incident”).
  • Root cause:
    • Reliance on a single gateway, no fallback routing, and no automated gateway health checks.
  • Business lens:
    • How much ad spend was effectively wasted sending traffic to a broken checkout, and how to prevent that link breaking again.

Key actions:

  • Implement payment router with multiple gateways and status checks.
  • Add alerts for failed payment attempts and gateway status page changes.
  • Create a “campaign emergency” playbook: pause or adjust campaigns when checkout is degraded.

Example 2: Slow checkout on mobile is killing conversions

Scenario: A new release adds heavy JS and third‑party tags on checkout, pushing mobile p95 load times above 4–5 seconds and cutting conversion significantly.

In the postmortem:

  • Impact:
    • p95 latency on /checkout before vs after the change.
    • Mobile Checkout→Purchase conversion drop, by device and browser.
  • Root cause:
    • No performance budgets or RUM alerts on checkout; change was tested on desktop only.
  • Business lens:
    • Estimated revenue lost during the degradation period; potential longer‑term abandonment from frustrated users.

Actions:

  • Add mobile RUM and performance alerts for checkout (LCP/INP/TTFB thresholds).
  • Establish a performance budget for checkout bundles and third‑party tags.
  • Require pre‑release testing on real mobile devices or emulators for every checkout‑related change.

Example 3: Bot flood destroys analytics and performance

Scenario: A bot campaign starts hammering your product listings and checkout, causing:

  • Traffic spikes with almost no conversions.
  • Analytics dashboards distorted (conversion rate plummets).
  • Higher error and timeout rates from overloaded backend services.

In the postmortem:

  • Impact:
    • Additional requests served, % of traffic suspected as bot, and infrastructure cost impact.
    • Distortion of funnel metrics (for example, “GA4 shows 3× traffic but flat revenue”).
  • Root cause:
    • Insufficient WAF/bot rules and rate limiting on search, listing, and checkout endpoints.
  • Business lens:
    • Misleading marketing decisions due to polluted data, wasted ad budget, and degraded experience for real customers.

Actions:

  • Deploy bot detection and WAF rules to challenge/block abusive traffic, especially on search and checkout.
  • Create bot‑filtered analytics segments and alert when bot traffic suddenly spikes so teams know metrics are skewed.
  • Add rate limits on sensitive endpoints to protect infra and checkout reliability.

A good ecommerce incident postmortem reads like a short story about how customers and revenue were affected, why it happened, and what you’ll change—with enough technical detail for engineers and enough business framing for marketing and leadership. If you treat each outage as a conversion experiment you didn’t mean to run, your postmortems become one of the most powerful tools for making both your store and your revenue more resilient.

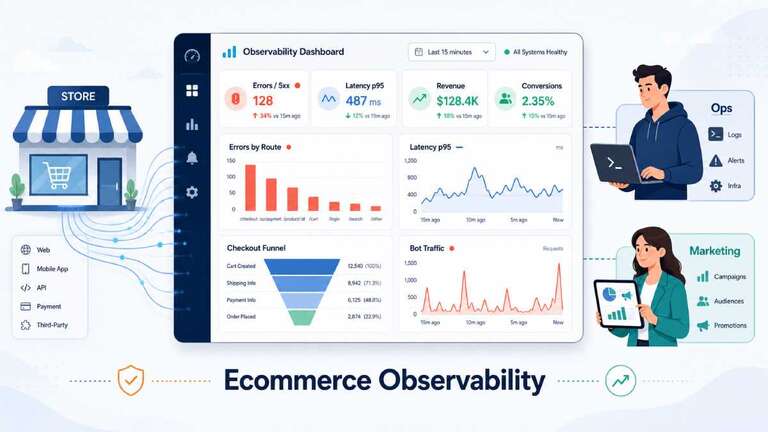
How to Build an Ecommerce Observability Stack: Logs, Metrics, and Alerts for Store Owners

An ecommerce observability stack is what tells you, in near real time, whether your site is fast, error‑free, and actually converting—not just “up.” It connects ops metrics (latency, 4xx/5xx, bot spikes) to marketing and revenue metrics (funnel drop‑offs, lost orders).

Here’s how to build one that store owners and marketers can both use.

What “observability” should mean for an ecommerce store

Classic monitoring answers “Is my site up?” Observability answers better questions:

  • Which URLs are slow right now, and is that hurting conversions?
  • Are errors clustered on a specific step—like shipping selection or payment?
  • Did a bot spike or broken campaign just distort our analytics?
  • When performance regresses, what does it cost in revenue terms?

AWS and other observability guides usually frame the basics as availability, latency, and error rate, often derived from 4xx/5xx counts and request volumes. For ecommerce, you add funnel and traffic quality on top.

You want both:

  • A technical view (what’s broken, where, and how badly).
  • A business view (what that means for add‑to‑cart, checkout, and revenue).

Core signals your stack must track

1. Errors by route (4xx/5xx) and availability

Error rate is simply the percentage of failed requests, usually based on HTTP status codes:

  • 4xx = client or user errors (bad input, validation, blocked)
  • 5xx = server errors (code bugs, timeouts, infra problems)

A common availability formula is:

Availability Count

For an ecommerce store, track:

  • 4xx/5xx per critical route: product pages, cart, checkout, login, payment endpoints.
  • 4xx patterns that signal UX issues (e.g., validation failures on checkout).
  • 5xx patterns that signal outages or capacity problems.

If 5xx on /checkout jumps above even 0.5–1% over a 5‑minute window, that’s already costing you real orders.

2. Latency by page type and route (p50/p95/p99)

It’s not enough to know your “average” speed. You need percentiles (p50/p95/p99) and by route:

  • Product listing pages (PLP) and product detail pages (PDP) for discovery and consideration.
  • Cart and checkout pages for payment.

Real‑user monitoring studies show that when pages cross certain thresholds (especially on mobile), conversion starts dropping even if the site is technically “up.”

A useful pattern is:

  • p50 latency – typical user experience.
  • p95 latency – worst 5% of sessions; often where rage‑clicks and drop‑offs come from.
  • Track separately for: PDP → Cart → Checkout. A good PDP average can hide a catastrophically slow checkout.

3. Checkout funnel drop‑offs

Industry data pegs average cart abandonment around 70%, with a significant slice directly tied to checkout issues and friction.

Your observability stack should map technical health to funnel steps:

  • Sessions that view a PDP.
  • Sessions that add to cart.
  • Sessions that reach checkout.
  • Sessions that complete payment/see order confirmation.

For each step, track:

  • Conversion rate to the next step (PDP→Cart, Cart→Checkout, Checkout→Order).
  • 4xx/5xx rate on the pages powering that step.
  • Latency (p95) on those URLs.

When you see a sudden drop in Cart→Checkout while PDP→Cart stays normal, and at the same time 5xx on /checkout spiked, you can tie a technical issue directly to lost revenue instead of guessing.

4. Bot spikes and traffic quality

Bots can distort your data and load your stack without generating revenue. Common signs include:

  • Sudden spikes in sessions from unusual geos or data‑center IP ranges.
  • Huge traffic to search or product listing pages with no add‑to‑cart or checkout progression.
  • Lots of abandoned checkouts from obviously synthetic customer profiles.

From an observability perspective, you want:

  • Traffic volume by route segmented into “likely human” vs “likely bot” (Cloudflare bot scores, WAF logs, or behavior analysis).
  • Separate dashboards and segments for analytics that exclude bot and ghost sessions, otherwise funnel conversion and latency analysis becomes meaningless.

The building blocks of an ecommerce observability stack

You don’t need every tool under the sun, but you do need three layers working together.

1. Logs: your ground truth

Every request and every key event should produce a log line with at least:

  • Timestamp
  • Route / URL pattern
  • HTTP method and status code
  • Latency (ms)
  • User/session identifier (hashed)
  • Device/geo or user agent
  • Tags like step=pdp/cart/checkout, source=ads/email where possible

Server logs and application logs let you:

  • Aggregate errors by route.
  • Compute latency distributions.
  • Correlate specific error spikes with deployment times or third‑party failures.

Good practice is to centralize logs into something queryable (ELK/Opensearch, CloudWatch Logs, etc.) so you can slice them by route, geo, device, or funnel step.

2. Metrics: the summarized signals you alert on

Metrics compress log and trace data into time‑series you can graph and alert on:

Essential ecommerce metrics include:

  • Request count per route.
  • 4xx and 5xx counts per route.
  • Latency (p50/p95/p99) per route.
  • Conversion rates per funnel stage (from analytics or event stream).
  • Bot vs non‑bot traffic volume on key endpoints.

These feed dashboards and alerts. Many teams use Prometheus‑style histograms for HTTP request duration, labeled by handler/method/status, which is ideal for “errors by route” and “latency by route” panels.

3. Frontend UX and funnel analytics

Technical health alone isn’t enough—you need real‑user performance and funnel analytics:

  • Core Web Vitals (LCP, INP, CLS) by page type (PDP, cart, checkout).
  • Step‑level events in GA4 or similar (view_checkout, add_to_cart, begin_checkout, purchase).
  • Segments that exclude obvious bots and spam traffic so conversion numbers are trustworthy.

Also read about the key performance of ecommerce

Best‑practice guides emphasize combining real-user performance data with funnel outcomes to prioritize fixes that move revenue, not just synthetic scores.

Example dashboards that tie ops and marketing together

Dashboard 1: “Store health” overview

Panels:

  • Total requests & sessions (by device, geo).
  • Error rate (4xx/5xx) overall and for key routes (home, PDP, cart, checkout).
  • p50/p95 latency per key route.
  • Uptime / availability (based on 4xx/5xx/2xx mix).

Audience:

  • Ops sees where to triage when error or latency goes up.
  • Marketing sees whether a campaign is sending traffic to a healthy experience.

Dashboard 2: Checkout & cart health

Panels:

  • PDP → Cart → Checkout → Purchase funnel, with conversion rates by device.
  • 4xx/5xx on PDP, cart, and checkout routes.
  • p95 latency for cart and checkout specifically.
  • # of payment failures vs successes.

This surfaces subtle problems like:

  • Cart loads fine, but checkout intermittently 500s for mobile Safari.
  • A new payment gateway is timing out and increasing “payment failed” event counts.
  • New tracking script slowed checkout on mobile and reduced completion rate.

Dashboard 3: Bot & traffic quality

Panels:

  • Sessions and requests by country/ASN, with a “suspected bot” overlay.
  • Requests per minute on search and product listing routes, split by human vs bot.
  • Funnel conversion for human segment vs “all traffic” to demonstrate how bots are skewing analytics.

Ops can then tune WAF/bot rules or rate limits; marketing can filter campaigns and funnels to focus on real users.

Alerts that actually matter for store owners

You want alerts that answer “Is my store making money normally?” rather than just “Is CPU high?”

Good patterns:

  1. Checkout 5xx rate spike
    • Condition: 5xx on /checkout or payment endpoints > 1–2% for 5–10 minutes.
    • Impact: direct loss of orders; highest priority.
  2. Checkout p95 latency regression
    • Condition: p95 duration on checkout step > defined threshold (e.g., 2–3 seconds) compared to last 24h.
    • Impact: more drop‑offs and failed payments, especially on mobile.
  3. Funnel conversion anomaly
    • Condition: Cart→Checkout or Checkout→Purchase conversion drops X% vs rolling baseline (excluding bots).
    • Impact: something in UX, payments, or analytics broke.
  4. Bot traffic spike
    • Condition: Requests per minute from suspicious geos/ASNs or marked as “likely bot” spike above baseline.
    • Impact: skewed analytics, possible checkout/card testing abuse, extra infrastructure load.
  5. SLO burn for overall availability
    • Condition: Availability (based on 4xx/5xx) burns through your error budget too quickly (SLO burn rate).
    • Impact: repeated minor errors are adding up, risk to brand and revenue.

These alerts live at the boundary between ops (pages actually failing) and marketing (conversions and revenue dropping).

Making it usable for both ops and marketing

To keep this from becoming “just another ops dashboard” no one outside engineering looks at, you need:

  • Shared metrics: error rates and p95 latency next to funnel conversion and revenue for the same routes and time windows.
  • Shared vocabulary: marketing reports “checkout drop‑off up 5% on mobile,” ops can answer with “yes, p95 latency + 5xx increased on /checkout at the same time.”
  • A small, agreed‑upon set of SLOs around checkout, cart, and PDP that everyone cares about.

When you frame observability around “money is working / money is broken”—using logs, metrics, and alerts tailored to ecommerce paths—store owners, ops, and marketers all get what they need:

  • Ops knows what to fix first.
  • Marketing knows when not to launch heavy campaigns.
  • Owners see issues in minutes instead of days, with a clear sense of revenue impact.

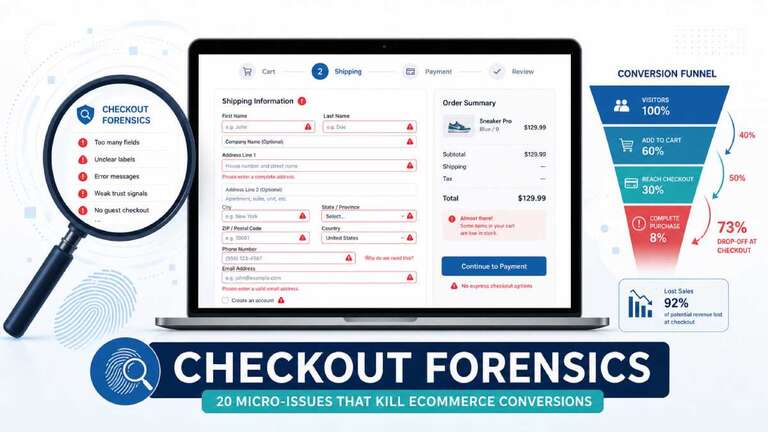
Checkout Forensics: 20 Micro‑Issues that Kill Ecommerce Conversions

Most checkout problems aren’t dramatic—they’re small friction points that quietly kill conversions. In 2026, average cart abandonment still sits around 70%, and “checkout issues” remain one of the top reported reasons shoppers bail. Research shows that extra costs, mandatory account creation, and long or complicated checkout flows drive a huge share of those lost orders.

This post is a forensic walkthrough of 20 tiny checkout issues that silently cost you money, plus how to spot and fix them—using OpenCart as the concrete example.

Why micro‑issues matter more than you think

Baymard and similar UX studies consistently find that form friction—not just the number of steps—is one of the biggest drivers of checkout abandonment.

  • The average checkout has roughly 11+ form fields, even though most stores need only 7–8 to complete a purchase.
  • As field counts cross 7–10, abandonment climbs sharply, with 27–37% of users citing “too long or complicated” forms as the reason they quit.

In other words, every unnecessary field, unclear error, or small UX bug is real money leaking out of your funnel.

Let’s audit those leaks.

1. Forced account creation before checkout

One of the top abandonment reasons is being forced to create an account before ordering. New shoppers see it as friction and a privacy risk.

OpenCart example

  • In OpenCart, enable Guest Checkout and Checkout without registering in the admin so first‑time buyers aren’t blocked by account creation.
  • Keep “Create an account” as an option after they’ve already committed to the order, not as a gate up front.

2. Hidden shipping and fees until the last step

Nearly half of shoppers abandon when they see unexpected costs (shipping, taxes, fees) at the final checkout screen.

OpenCart example

  • Show estimated shipping and taxes earlier—cart page, mini‑cart, and even product pages—using built‑in tax rules and shipping estimates.
  • Ensure your checkout summary box is always visible and updated as options change, not only on the final confirmation step.

3. Too many required fields

Studies show that the number of fields has a stronger impact on abandonment than the number of steps.

  • Each extra field beyond 7–8 significantly reduces conversion rates.

OpenCart example

  • Audit checkout/checkout.twig and remove anything you don’t absolutely need: fax, second phone, company field for B2C, redundant address lines.
  • Make less‑critical fields optional instead of mandatory and visually de‑emphasize them.

4. Wrong input types and keyboards on mobile

On mobile, using the wrong input types (text instead of emailtel, or number) forces extra taps and errors.

OpenCart example

  • Update your checkout Twig templates so that email, phone, and postal code fields use appropriate type attributes, and set autocomplete hints.
  • Test the end‑to‑end flow on real devices—especially with long forms and small screens.

5. No inline validation—only errors on submit

Form benchmarks show that inline validation (validating when the field loses focus) lifts completion rates by 5–13%, especially on longer forms.

If users only see errors after clicking “Confirm order” and losing context, they’re more likely to give up.

OpenCart example

  • Add basic JS validation to the most error‑prone fields (email, postcode, required address) and show success/error states on blur.
  • Avoid generic “Please check the form” alerts; highlight the specific field in error.

6. Clearing all fields after any error

Forcing users to re‑enter all data after a validation error is a conversion killer; up to 55% of shoppers will abandon if they have to re‑enter card or shipping info.

OpenCart example

  • Make sure your controller logic re‑renders the form with the user’s previously entered values intact.
  • When validation fails, highlight only the problem fields and scroll to the first error instead of wiping everything.

7. Confusing or generic error messages

Technical error messages and generic “Error!” prompts cause abandonment because the user doesn’t know what to fix.

OpenCart example

  • Replace raw gateway or API error codes with human‑readable messages like “This card was declined. Try another card or contact your bank,” not “Payment error: code 5021”.
  • Keep messages adjacent to the relevant field and use clear, friendly language.

8. Poor field order and grouping

Bad ordering—such as asking for postcode last or mixing billing and shipping fields—forces users to zig‑zag mentally, adding friction.

OpenCart example

  • Group address inputs logically: name → street → city → postcode → country → region.
  • If most orders are domestic, pre‑select your main country and move exotic options into a searchable dropdown.

9. No visible progress indicator

Progress indicators reduce uncertainty and abandonment by letting users know “where they are” and what’s left.

OpenCart example

  • If you use multi‑step checkout, add a simple visual stepper (“Cart → Details → Shipping → Payment → Review”) above the form.
  • Ensure the step labels reflect what actually happens on each page.

10. Slow checkout pages and heavy scripts

More than half of shoppers say they will abandon if they have to wait more than a few seconds for pages to load. Heavy JS, unoptimized images, and third‑party widgets can stall your most valuable page.

OpenCart example

  • Audit your checkout route with browser DevTools and Lighthouse; remove unnecessary scripts and third‑party tags from checkout templates.
  • Use Cloudflare and server‑side caching where safe, and avoid running heavy A/B or tracking scripts on the final steps.

11. Distracting header, mega menus, and promos

Checkout pages that look like every other page—with full navigation, sliders, and promos—invite distraction and leaks out of the funnel.

OpenCart example

  • Use a simplified header/footer on checkout: logo + minimal nav, no mega menus, no hero sliders.
  • Move newsletter popups, cross‑sells, and long marketing content away from the payment step.

12. Weak trust signals at the moment of payment

Around 17–25% of shoppers abandon because they don’t fully trust the site with card details.

OpenCart example

  • Show visible SSL/https indicators, concise security copy (“Secure checkout, encrypted connection”), and recognized payment provider logos near the payment form.
  • Make sure your page loads without mixed‑content warnings or browser security errors.

13. Limited payment options

Not having the payment methods shoppers expect—wallets, local methods, BNPL—leads to drop‑off, especially across different regions and demographics.

OpenCart example

  • Offer at least one major card processor plus one or two regionally relevant methods (PayPal, wallets, or local gateways).
  • Hide or reorder methods so the most common ones appear first; don’t bury them.

14. Limited or unclear shipping options and ETAs

Shoppers want predictable delivery; unclear or inflexible options push them away.

  • Lack of clear delivery dates or limited choices is a subtle but real conversion drag.

OpenCart example

  • Configure shipping methods with descriptive labels and realistic ETAs (“Delivered in 2–4 business days”).
  • If possible, show a free shipping threshold or the cheapest option early in the journey.

15. Coupon box UX that creates friction

Shoppers will go hunting for codes if the coupon box is prominent; they may return with a bad code, and failed coupons are a frequent abandonment trigger.

OpenCart example

  • Keep the coupon field accessible, but not the hero of the page.
  • Provide clear, specific error messages for invalid or expired codes, and avoid nuking the form when a code fails.

16. No easy cart editing from checkout

If users need to leave checkout to change quantity or remove an item, they’re at higher risk of abandoning entirely.

OpenCart example

  • Include a small order summary in checkout with quantity controls or at least “Remove” links and a quick way back to cart without losing data.
  • Ensure any cart changes instantly refresh totals without a full reload where possible.

17. Forced newsletter opt‑in or unexpected consents

Surprise checkboxes for newsletters or ambiguous consent language increase friction and distrust.

OpenCart example

  • Make newsletter opt‑in clearly optional and default to unchecked.
  • Use concise, honest copy about what subscribing means; keep legal/GDPR copy readable, not walls of text.

18. No “save cart” or recovery path

Life happens. If there’s no “save for later” option, non‑committal shoppers either abandon or use the cart as a wishlist, which isn’t structured for recovery.

OpenCart example

  • Enable basic wishlist features and make them visible near the cart.
  • Use abandoned cart emails (via extensions) to bring people back when they do drop off.

19. Technical glitches, JS errors, and timeouts

Broken validation, JS errors, and session timeouts show up as generic “something went wrong” moments that users rarely bother to report.

OpenCart example

  • Log errors server‑side and track console errors on checkout specifically.
  • Shorten time between releases and regression tests: every theme or extension update should include a full test of the checkout journey.

20. No analytics on where checkout fails

You can’t fix what you don’t measure. Many stores track “added to cart” and “thank you,” but not where the leak happens: shipping step, payment step, address form, or after errors.

OpenCart example

  • Instrument step‑level events (viewed checkout, started shipping, selected payment, submit order) in GA4 or your analytics of choice.
  • Combine that with error logging so you can see not just that people drop, but what they were trying to do when they did.

Turning this into a repeatable “checkout forensic” process

You can turn these 20 micro‑issues into a simple forensic checklist:

  • Start with data: identify drop‑off steps and devices.
  • Run a detailed form and interaction audit against this list.
  • Fix the highest‑impact friction first: unnecessary fields, hidden costs, forced accounts, trust signals, speed.
  • Re‑measure conversion and abandonment after each batch of changes.

The big wins rarely come from a total redesign—they come from eliminating the dozen tiny cuts that make a shopper decide “not worth it” right when they were ready to pay.

Cloudflare Security for OpenCart: WAF, Rate Limiting, and Bot Protection (with Example Rules)

Once you’ve decided to put Cloudflare in front of your OpenCart store, the real value comes from how you configure it. This post goes deeper into exact rule expressions you can use for WAF, rate limiting, and bot protection around typical OpenCart routes.

Setup cloudflare in Opencart

The examples use Cloudflare’s WireFilter expression syntax (the same format you see in the “Expression Editor” when creating Firewall or WAF rules).

1. WAF / Firewall Rules for OpenCart

1.1. Protect the admin URL

Assume your admin path is /admin/. A classic pattern is:

  • Allow your own IP(s) unconditionally.
  • Challenge or block everyone else.

Allowlist your IP for admin

Action: Allow (and place this rule above stricter ones)

(ip.src in {198.51.100.10 203.0.113.25} and http.request.uri.path starts_with "/admin")

Challenge all other access to /admin

Action: Managed Challenge or Block

(http.request.uri.path starts_with "/admin" and not ip.src in {198.51.100.10 203.0.113.25})

This pattern is similar to how many Cloudflare guides suggest securing admin panels: IP allowlist plus a challenge or block fallback.

If you’ve renamed the admin directory, just swap /admin with your custom path.

1.2. Harden customer login and account endpoints

OpenCart account routes typically live under index.php?route=account/*. Community rules often challenge or block anything hitting login/register/forgotten, especially if traffic patterns look automated.

Challenge sensitive account routes

Action: Managed Challenge

(lower(http.request.uri.query) contains "route=account/login"
or lower(http.request.uri.query) contains "route=account/register"
or lower(http.request.uri.query) contains "route=account/forgotten")

You can make this stricter by adding method constraints or bot score checks (see bot section below).

1.3. Add extra scrutiny to checkout

Checkout abuse (card testing, scripted attempts) often targets route=checkout/checkout and related endpoints.

Challenge suspicious checkout access

Action: Managed Challenge

(lower(http.request.uri.query) contains "route=checkout/checkout"
 or lower(http.request.uri.query) contains "route=checkout%2fcheckout")

Borrowing from community patterns, you can also add conditions to focus on POSTs only:

(http.request.method eq "POST"
 and (lower(http.request.uri.query) contains "route=checkout/checkout"
      or lower(http.request.uri.query) contains "route=checkout%2fcheckout"))

Start with “Managed Challenge”. If you see malicious automation and no false positives, you can selectively move some traffic to Block.

2. Rate Limiting Rules for OpenCart

Cloudflare’s Rate Limiting Rules let you define expressions, thresholds, and actions when a client exceeds a limit.

2.1. Rate-limit customer login to stop brute force

Let’s say your login route is index.php?route=account/login and you want to rate-limit brute-force attempts.

Expression for login path

(http.request.method eq "POST"
 and lower(http.request.uri.query) contains "route=account/login")

In the Rate Limiting UI:

  • Expression: (above)
  • Counting key: ip.src (default IP-based limit)
  • Threshold: e.g., 10 requests per 1 minute
  • Action: Block or Managed Challenge for 10–15 minutes

Cloudflare’s docs show similar examples for login endpoints, where POST + specific path are used as rate limiting keys.

2.2. Rate-limit search to slow scrapers

Assume your search route is index.php?route=product/search. Scrapers often hammer this with many queries.

Expression for search

(http.request.method eq "GET"
 and lower(http.request.uri.query) contains "route=product/search")

Rate limiting config:

  • Threshold: e.g., 60 requests per 1 minute per IP
  • Action: Managed Challenge or Block for a few minutes

Use a more generous threshold here so power-users and genuine shoppers don’t get blocked. The idea is to catch clients firing hundreds of searches in seconds, not normal browsing.

2.3. Rate-limit checkout POSTs

To protect against bots spamming checkout:

(http.request.method eq "POST"
 and lower(http.request.uri.query) contains "route=checkout/checkout")

Then:

  • Threshold: e.g., 20 POSTs per 5 minutes per IP
  • Action: Managed Challenge or Block

Again, tune thresholds by watching logs. Cloudflare rate limiting best practices recommend verifying normal behavior first, then tightening thresholds once you know typical patterns.

3. Bot Protection Rules (Using Bot Scores)

Cloudflare’s Bot Management assigns each request a bot score (cf.bot_management.score) between 1–99.

  • Score ≈ 1 → almost certainly automated
  • Score ≈ 99 → almost certainly human

You can use bot scores in rules to challenge or block automation on specific OpenCart paths.

3.1. Block definitely automated bots anywhere

Action: Block

(cf.bot_management.score eq 1 and not cf.bot_management.verified_bot)

This is similar to Cloudflare’s example that blocks requests with a score of 1 while skipping verified bots.

3.2. Challenge likely bots on login and account

Combine bot score with your account routes:

Action: Managed Challenge

(cf.bot_management.score lt 30
 and not cf.bot_management.verified_bot
 and (lower(http.request.uri.query) contains "route=account/login"
      or lower(http.request.uri.query) contains "route=account/register"
      or lower(http.request.uri.query) contains "route=account/forgotten"))

Here:

  • cf.bot_management.score lt 30 targets likely automation.
  • not cf.bot_management.verified_bot excludes good crawlers.
  • Path conditions restrict challenges to account-related actions.

3.3. Challenge suspicious bots on checkout

Action: Managed Challenge

(cf.bot_management.score lt 40
 and not cf.bot_management.verified_bot
 and (lower(http.request.uri.query) contains "route=checkout/checkout"))

This rule challenges likely bots at checkout without affecting legitimate human shoppers, since their scores are usually high.

3.4. Let verified bots crawl products but not sensitive flows

Action: Skip (for good bots on safe paths)

(cf.bot_management.verified_bot
 and (starts_with(http.request.uri.path, "/")
      and not lower(http.request.uri.query) contains "route=account/"
      and not lower(http.request.uri.query) contains "route=checkout/"))

This pattern mirrors Cloudflare’s suggestion to skip verified bots for catalog assets while still subjecting them to stricter rules on sensitive endpoints.

4. Putting It Together: Example Rule Set for an OpenCart Store

You could present a baseline stack like this in your blog:

  1. Firewall / WAF rules
    • Allowlist your admin IPs and challenge everyone else on /admin.
    • Managed Challenge on account and checkout routes.
    • Optional geo/user-agent filters to skip obviously malicious traffic.
  2. Rate limiting rules
    • Login POST rate limiting (credential stuffing protection).
    • Search rate limiting to slow scrapers.
    • Checkout POST rate limiting to stop card testers and abuse.
  3. Bot score rules
    • Block score 1 bots globally (non-verified).
    • Challenge likely bots (<30–40) on login and checkout.
    • Skip verified bots on product/catalog paths.

Each rule has a clear expression you can paste into the dashboard, and you can walk readers through how to test each in “Log/Simulate” mode first (as Cloudflare’s firewall and rate limiting best-practices docs advise).

Making an OpenCart Store Agent‑Ready: Product Data, Schema, and APIs for AI Shoppers

Agent‑ready OpenCart means building your store for two audiences at once: humans and AI shopping agents. AI agents need clean product data, rich schema, and reliable APIs before they can confidently recommend or buy from you. This post walks through how to get there with OpenCart.


What “agent‑ready” actually means

In agentic commerce, AI assistants find, compare, and sometimes purchase products on behalf of shoppers. They care about:

  • Structured product facts, not just pretty descriptions.
  • Machine‑readable policies like shipping, returns, and availability.
  • Stable APIs to query your catalog and create carts or orders.

If your OpenCart store only looks good to humans but is opaque to machines, AI agents will often skip you—even if your products are excellent.

Step 1: Clean, structured product data inside OpenCart

Before schema or APIs, fix the source of truth: your catalog.

Key areas to tighten:

  • Attributes and options
    • Use attributes for real product properties (material, fit, wattage, compatibility), not just “SEO filler.”
    • Normalize values (e.g., “100% cotton” vs random variations) so agents can filter and compare cleanly.
  • Categories and taxonomy
    • Avoid over‑flat or over‑deep trees; think in terms of how a model would cluster products (type → use case → audience).
    • Ensure every product has a clear primary category and consistent related categories.
  • Availability and stock
    • Keep stock and availability fields accurate; many agents treat “in stock” vs “out of stock” as hard filters.
    • Use real lead times where possible (e.g., “Ships in 2–3 days”) rather than vague text.
  • Policy data in the admin
    • Standardize shipping methods, delivery estimates, and returns in configuration and language files, not free‑form per‑product text.
    • This makes it easier to express them later in structured schemas like MerchantReturnPolicy.

You’re basically making your OpenCart admin a high‑quality dataset that schema and APIs can expose.

Step 2: Add rich schema.org JSON‑LD to product pages

Agentic commerce readiness starts with schema.org markup that goes beyond a bare Product + Offer.

Core schemas to implement

A practical agent‑ready product page should expose at least:

  • Product – name, description, images, brand, GTIN/MPN, category.
  • Offer – price, priceCurrency, availability, itemCondition, url.
  • AggregateRating – average rating and review count if you have enough volume.
  • Review – recent reviews with rating and author where available.
  • MerchantReturnPolicy – return window, method (by mail, in store), restocking fees, etc.

Deloitte and other agentic commerce guides specifically call out Product, Offer, MerchantReturnPolicy, and AggregateRating as baseline context AI agents will use for decisioning.

How to wire it in OpenCart

You have two main options:

  1. Hand‑coded JSON‑LD in product.twig
    • Add a <script type="application/ld+json"> block in catalog/view/theme/yourtheme/template/product/product.twig.
    • Populate fields using Twig variables like {{ heading_title }}{{ price }}{{ special }}{{ stock }}, and review data.
    • FeedArmy’s guide shows a working JSON‑LD Product + Offer snippet tailored to OpenCart 3 that you can adapt to OpenCart 4.
  2. Schema modules for OpenCart
    • Extensions like “Structured Data Schema.org” and “Schema Markup Pro” inject JSON‑LD for store, product, category, and rich snippets without core edits.
    • They typically cover Product and Offer out of the box and can be extended to include return policy and ratings.

Whichever route you pick, validate your JSON‑LD with Google’s Rich Results Test and Schema.org validators, then run test queries in AI assistants to see what they “see.”

Step 3: Express store‑level trust signals in schema

Agents aren’t just picking products; they’re also evaluating where to buy from.

For that, expose:

  • Organization / LocalBusiness
    • Use a store‑wide JSON‑LD block with your business name, logo, URL, contact info, and social profiles.
    • Include opening hours and location if relevant.
  • MerchantReturnPolicy (store‑wide)
    • Add a site‑level policy schema that references your main returns page and outlines return window, method, and exceptions.
    • Link this from product‑level Offer/MerchantReturnPolicy where appropriate.
  • BreadcrumbList
    • Proper breadcrumb schema helps both classic SEO and AI agents understand your site structure and relationships between categories.

Modules like Schema Markup Pro already handle BreadcrumbList and basic Organization markup; you can extend their JSON‑LD arrays to include return policies or additional properties.

Step 4: Make your OpenCart APIs friendly to agents

Schema gets you discovered; APIs let agents actually use your store.

Leverage and harden the OpenCart 4 API

OpenCart’s core API provides JSON responses for common operations like login, cart, and orders.

  • Your own API doc on webocreation shows the account login endpoint (/index.php?route=api/account/login) and how to call it with cURL to obtain an API session.
  • Once authenticated, you can perform CRUD operations—add products to cart, manage addresses, place orders—via routes exposed by the core API.

To make this agent‑ready:

  • Prefer token‑based auth over brittle sessions where possible
    • If you stick with the default session‑based approach, make sure timeouts and IP restrictions are configured for realistic agent use.
  • Return consistent, versioned JSON
    • Don’t change response shapes without versioning; consider a version prefix or custom route set (e.g., api/v1/products).

Consider REST extensions with Swagger/OpenAPI

If you want a more discoverable surface for agents and integrators:

  • Modules like “OpenCart Dynamic API & Swagger Documentation” auto‑discover models/controllers and expose them as REST endpoints with generated OpenAPI specs.
  • REST packages like OCRESTAPI offer a mobile‑friendly and third‑party‑integration‑friendly API layer, with endpoints for product lists, details, reviews, and more.

Having an OpenAPI/Swagger spec is particularly useful as agent platforms increasingly ingest machine‑readable API definitions to learn how to interact with services.

Step 5: Design APIs for agentic use cases, not just back office

AI shoppers will rarely need your entire admin API surface. Focus on the flows agents actually perform:

  • Discovery
    • Public product search, category listing, filtering by attributes and availability.
    • Lightweight endpoints that return just enough data for comparisons (price, stock, attributes, policy refs).
  • Evaluation
    • Detailed product endpoints with the same data you expose in schema: attributes, images, ratings, rich descriptions, and policy links.
    • Promotion and discount info in structured form where possible.
  • Transaction
    • Cart endpoints (create, update, list) that support specifying quantities, variations/options, and coupon codes.
    • Checkout/order creation endpoints that respect user’s stored preferences for shipping and payment (potentially mediated via external payment APIs).
  • Post‑purchase
    • Endpoints to retrieve orders, initiate returns (or at least request forms), and track shipments.

The Deloitte and Stripe guides on agentic commerce both emphasize that well‑scoped, interoperable APIs are central to enabling agent‑to‑brand and agent‑to‑agent commerce.

Step 6: Guardrails — security, rate limits, and abuse prevention

Agent‑ready must not mean “wide open.”

  • Authentication & authorization
    • Treat agent integrations like any other third‑party app: scoped credentials, IP whitelists, and strict permissions.
    • If you deploy REST extensions, review their permission model and lock down admin‑side methods.
  • Rate limiting and abuse protection
    • Implement rate limits at the web server, API gateway, or Cloudflare level to prevent abusive scraping or brute‑force behavior while allowing legitimate agent traffic.
    • Separate keys or IP ranges for high‑trust partners vs unknown agents.
  • Monitoring and logging
    • Log user agents, API keys, and key operations (cart creation, checkout, price checks) to identify emergent agent traffic patterns.
    • Use these logs to tune limits and detect anomalous behavior.

Agentic commerce frameworks warn that poorly guarded APIs can become magnets for fraud and data exfiltration if they are opened up without proper governance.

A practical “agent‑ready” checklist for OpenCart

To recap, here’s a concrete checklist you can use on your next OpenCart project:

  • Catalog
    • Attributes normalized and meaningful, not just SEO padding.
    • Categories reflect real product groupings and use cases.
    • Stock and availability always accurate.
  • Schema
    • JSON‑LD Product + Offer + AggregateRating on all PDPs.
    • MerchantReturnPolicy defined at store and product level.
    • Organization/LocalBusiness + BreadcrumbList configured.
  • APIs
    • OpenCart 4 API endpoints tested and documented; consistent JSON.
    • Optional REST extension with Swagger/OpenAPI spec for external integrators and agents.
    • Clear flows for search, product details, cart, checkout, and orders.
  • Security & ops
    • Scoped API credentials, IP controls, and reasonable timeouts.
    • Layered rate limiting and bot/agent management at your edge.
    • Logs and dashboards to observe agent traffic and troubleshoot.

If you get these pieces right, your OpenCart store stops being just another website and becomes a well‑described, well‑behaved commerce service that both humans and AI agents can trust and transact with.