Finding Slow Queries in OpenCart: The MySQL Slow Query Log, EXPLAIN and the Indexes That Matter (Benchmarked)
A benchmarked guide to finding slow database queries in OpenCart 4 with the MySQL/MariaDB slow query log, mysqldumpslow and EXPLAIN, using a copy of a store with 20,000 products and 200,000 orders. The biggest win was one admin setting; the clearest missing index was on order history.
 Rupak NepaliPublished Nov 17, 2026
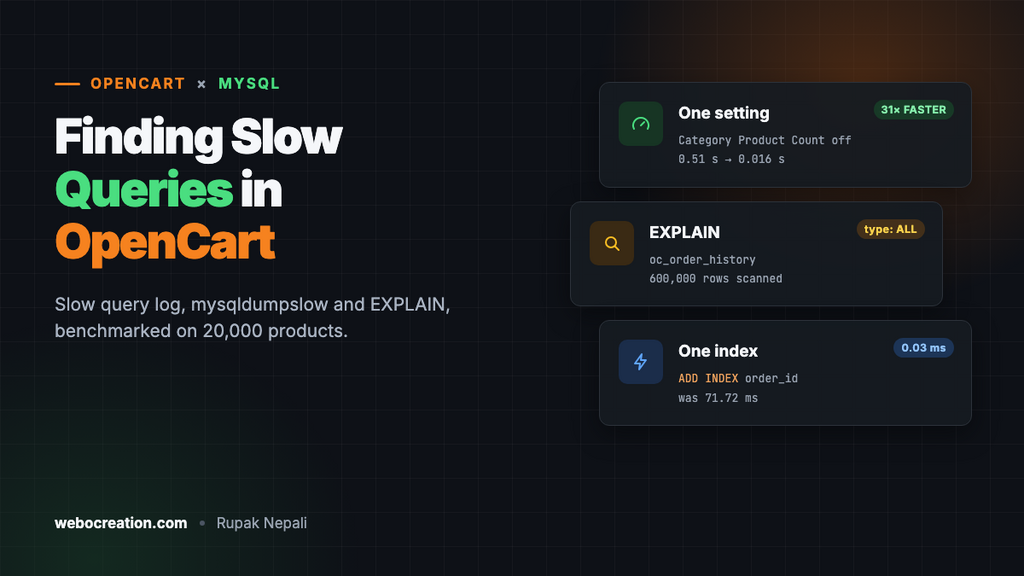
When an OpenCart store gets slow, the database is the usual suspect, and the usual advice is a list of generic MySQL tuning tips. It’s more useful to measure: find the queries that actually cost time on your store, see why with EXPLAIN, and fix those.
We did exactly that on a copy of an OpenCart 4.1.0.4 store, filled with 20,000 products, 200,000 orders, 600,000 order history rows and 300,000 customer activity rows, on MariaDB 11.8. The results were not what generic advice predicts: the biggest win was one setting, and only one missing index made a dramatic difference.
What we found
| Change | Before | After |
|---|---|---|
| Turn off Category Product Count (home page) | 0.51 s, 126 queries, 2,705,083 rows examined | 0.016 s, 99 queries, 1,327 rows examined |
| Category page, same setting | 0.69 s | 0.028 s |
| Search page, same setting | 0.52 s | 0.037 s |
Index on oc_order_history.order_id: count of an order’s history | 25.11 ms | 0.01 ms |
| Same index: the order page’s history list | 71.72 ms | 0.03 ms |
Index on oc_product_reward (product_id, customer_group_id) | Category page 0.025 s | 0.026 s (no measurable change) |
Page times are the median of 7 requests after 2 warm-ups, measured with curl on a local Docker setup; query times are MariaDB’s own ANALYZE timings. Your numbers will differ, but the proportions are what matter.
Step 1: Turn on the slow query log
The slow query log records every query that takes longer than a threshold, with how many rows it examined. Do this on a staging copy first if you can; on a live server, enable it for an hour and turn it off again.
Without a restart, as a database user with admin rights (MySQL 8 and MariaDB):
SET GLOBAL slow_query_log_file = '/var/log/mysql/slow.log';
SET GLOBAL long_query_time = 0.1;   -- seconds; 0 logs every query
SET GLOBAL slow_query_log = 1;

-- ...browse the store, or wait for real traffic...

SET GLOBAL slow_query_log = 0;
To keep it on permanently, add the same settings to the server’s configuration file under [mysqld]:
slow_query_log      = 1
slow_query_log_file = /var/log/mysql/slow.log
long_query_time     = 0.5
On shared hosting you usually can’t change these; ask your host, or use a staging copy on your own computer. Managed databases (Amazon RDS, DigitalOcean, Google Cloud SQL) set them through a parameter group or flags in their dashboard.
We set long_query_time = 0 to log everything, then opened six pages: home, a category (page 1 and page 50), two searches and a product.
Step 2: Summarise the log
A raw slow log is thousands of lines. mysqldumpslow (called mariadb-dumpslow on MariaDB) groups identical queries, replacing the values with N and 'S', and sorts them. -s t sorts by total time, which is what you want: a 20 ms query that runs 182 times costs more than one 40 ms query.
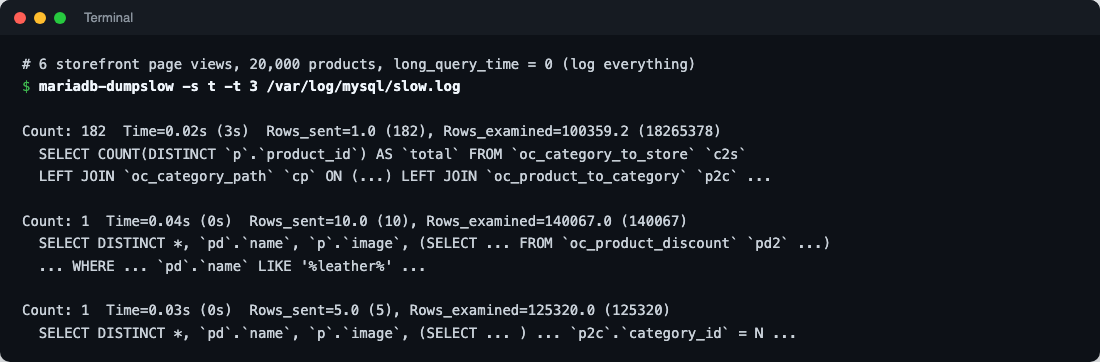
Read each group’s first line: Count is how often it ran, Time the average and (total), and Rows_examined the average and (total) rows MySQL had to look at. High rows examined for few rows sent is the sign of a query doing far more work than it needs to.
Finding 1: Category Product Count
The top query counts the products in a category and all its subcategories. It ran 182 times in six page views because OpenCart runs it for every category in the menu, on every page, when Category Product Count is on, to show “Laptops (5000)”. It isn’t cached. With 20,000 products, each count examined about 100,000 rows.
OpenCart’s own help text under the setting warns about this:

Turning it off took the home page from 0.51 s to 0.016 s, and rows examined per page view from 2.7 million to 1,327. If you have more than a few hundred products, turn it off. Shoppers rarely miss the numbers.
Step 3: EXPLAIN a suspicious query
Our extended log (log_slow_verbosity = 'query_plan,explain' on MariaDB) also showed plans. To check one yourself, put EXPLAIN in front of the query. The columns to read:
| Column | Good | Bad |
|---|---|---|
type | const, eq_ref, ref, range | ALL (reads the whole table), index (reads the whole index) |
key | An index name | NULL: no index used |
rows | Close to the number of rows you expect back | The size of the table |
Extra | Using index | Using filesort, Using temporary on large row counts |
Finding 2: order history has no index on order_id
When you open an order in the admin, OpenCart counts and lists that order’s history (Pending, Processing, Shipped…) with WHERE order_id = .... In OpenCart 4.1.0.4, oc_order_history has only its primary key, so each lookup reads the whole table:
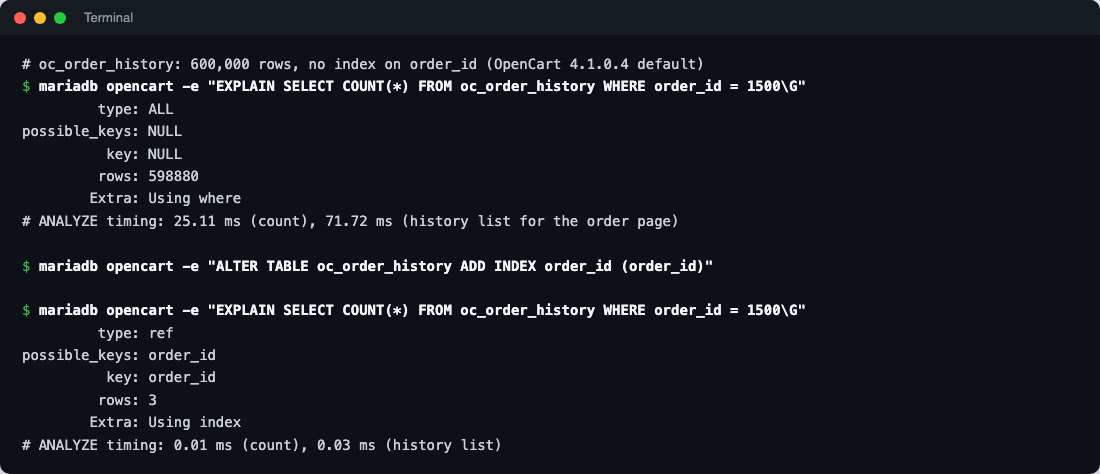
ALTER TABLE oc_order_history ADD INDEX order_id (order_id);The count went from 25.11 ms to 0.01 ms, the history list from 71.72 ms to 0.03 ms. A store with 10,000 orders won’t notice; one with hundreds of thousands, where staff open orders all day, will. Adding an index is safe and doesn’t change any data, but it locks the table briefly while it builds: do it at a quiet time and take a backup first.
Other tables to check
On our copy, these tables also had no index on a column OpenCart filters by. Check them against your own slow log before adding anything:
| Table | Filtered by | Matters when |
|---|---|---|
oc_customer_activity | customer_id | Customer activity tracking is on and the table is large |
oc_product_reward | product_id | You use reward points on thousands of products. In our test the effect was too small to measure, because only the 10 or so products on the page are looked up |
oc_product | status, date_available | Rarely: product queries start from other tables and join by primary key |
Don’t add indexes “just in case”: each one slows down writes a little and takes space. Add one when the slow log and EXPLAIN show a query that needs it.
Finding 3: search can’t use an index
The search query examined 140,067 rows for 10 results. OpenCart searches with pd.name LIKE '%leather%'; a pattern starting with % can’t use the index on the product name, so every product description is read. At 20,000 products it still took only about 40 ms, so it’s fine for most stores. With hundreds of thousands of products, or if you search descriptions too, move search to a search engine: see Meilisearch or Typesense for OpenCart 4.
What didn’t matter
The category page’s product listing query, with its subqueries for specials, discounts, rewards and reviews, looked complicated in EXPLAIN (dependent subqueries, a temporary table, a filesort), but took 20 to 40 ms at 20,000 products. Complicated plans aren’t automatically slow; measure first.
Quick checklist
- Turn off Category Product Count unless your catalog is small.
- Turn on the slow log for an hour of real traffic with
long_query_time = 0.1. - Run
mysqldumpslow -s t -t 10and look at the top queries by total time. EXPLAINeach one; look fortype: ALLon big tables.- Add an index only where a query needs it; measure before and after.
- Clean up tables that grow forever: old sessions, customer activity, customer searches and the error log.
Beyond the database
After the database, the next gains come from caching and the server. See 10 ways to speed up OpenCart. If pages fail rather than run slowly, start with debugging OpenCart 4.
How we tested
We never benchmark on a live database. We copied the store’s database into a separate, throwaway MariaDB 11.8 container, generated the extra products, orders and history rows with SQL, and pointed a second copy of the store at it. All storefront queries came from real page loads through OpenCart; the order history queries were copied from admin/model/sale/order.php and timed with MariaDB’s ANALYZE FORMAT=JSON. The containers were deleted afterwards.

Rupak Nepali is a web developer, manage Webocreation website and the author of six books:
Getting Started with OpenCart Module Development (Packt, 2013),
OpenCart Theme and Module Development (Packt, 2015),
OpenCart 4: Dev Guide for Themes & Extensions (2024),
OpenCart 4: User Manual (2025),
Cloudflare for the Enterprise Website (2026) and
The Technical Web Guide for Marketers (2026).
Rupak has built OpenCart stores and extensions since 2010, has published more than 600 tutorials on Webocreation, and shares free OpenCart extensions on GitHub.
Find Rupak on
GitHub | Amazon | LinkedIn | X | YouTube.