Chapter 8: Experimentation, Conversion Optimization, and Reporting
By the end of this chapter you will be able to:
 Rupak NepaliPublished Nov 10, 2026
Learning objectives
By the end of this chapter, you will be able to:
- Choose the right KPIs and build a metrics hierarchy from business goals to daily signals.
- Design valid A/B tests with clear hypotheses, sample sizes, and success criteria.
- Apply conversion rate optimization (CRO) principles to landing pages and checkouts.
- Avoid the most common analytical mistakes.
- Write reports and presentations that drive decisions.
- Use AI to generate test ideas, analyze results, and draft reports.
From metrics to decisions
Chapter 7 showed you how to collect data. This chapter is about turning data into decisions, which is where analysts earn their salaries. A marketing team can drown in numbers and still not know what to do on Monday morning. The cure is a clear hierarchy of metrics.
The metrics hierarchy
- North Star metric: the single measure that best captures the value customers get from your business and predicts long-term growth. For Brightleaf, it might be active subscribers. For a software company, it might be weekly active teams.
- Business KPIs: the few outcomes leadership tracks: revenue, new customers, CAC, LTV, churn.
- Channel KPIs: the outcomes each channel owns: organic sessions and conversions for SEO, CPA and ROAS for paid search, revenue per email for email, engaged reach and click-throughs for social.
- Diagnostic metrics: the levers that explain changes in KPIs: CTR, conversion rate by step, average order value, bounce or engagement rate, open and click rates.
When a KPI moves, you drill down through the hierarchy to find out why. Revenue fell? Was it fewer visitors or lower conversion? If lower conversion, which step, which device, which channel? This structured drill-down is exactly what interviewers test with case questions.
Vanity metrics versus actionable metrics
Vanity metrics look good but don’t guide decisions: total followers, total page views, raw impressions. Actionable metrics connect to outcomes and suggest what to do: conversion rate by landing page, CPA by campaign, retention by cohort. Vanity metrics aren’t useless (reach matters for awareness campaigns), but never report them without context and a link to business results.
The experimentation mindset
The best marketing teams treat every idea as a hypothesis to test rather than an opinion to argue about. “I think the green button will work better” becomes “Let’s test it.” This removes politics from decisions and steadily compounds improvements.
Anatomy of a good hypothesis
Because we observed [data or insight], we believe that [change] for [audience] will cause [effect on metric]. We’ll know this is true when we see [measurable outcome] after [duration or sample size].
Example: Because session recordings show many mobile users scrolling past the subscription plans without selecting one, we believe that adding a three-question “find your coffee” quiz above the plans for mobile visitors will increase subscription starts. We’ll know this is true when the subscription conversion rate for mobile visitors rises by at least 10% relative, at 95% confidence, after reaching the planned sample size.
A/B testing basics
In an A/B test, you randomly split visitors between the original version (control, A) and a changed version (variant, B), then compare results. Randomization is what lets you attribute differences to the change rather than to who happened to visit.
Key concepts:
- Primary metric: the one metric that decides the test. Choose it before launching.
- Guardrail metrics: metrics that must not get worse (for example, average order value or refund rate).
- Sample size: how many visitors each version needs to detect a realistic effect. Use a free sample size calculator. Small sites often need weeks to reach adequate samples, which is why small businesses should test bold changes rather than tiny tweaks.
- Statistical significance: an indication that the observed difference is unlikely to be due to chance alone. A common threshold is 95% confidence.
- Minimum detectable effect: the smallest improvement your test is designed to detect reliably.
- Duration: run tests for at least one full week (preferably two) to capture weekday and weekend behavior, and don’t stop early just because the result looks significant on day three. “Peeking” inflates false positives.
What to test, in order of typical impact: the offer (price, discount, guarantee, free trial) → the value proposition and headline → the page structure and amount of information → the call to action and form fields → visual design details. Button colors are rarely where the big wins are.
Tools: Many platforms include testing features (email platforms test subject lines; Google Ads offers experiments; Meta offers A/B tests). For websites, dedicated tools include Optimizely, VWO, AB Tasty, and others, and many e-commerce and landing page builders have built-in testing. (Google Optimize, a popular free tool, was discontinued in 2023.)
Prompt 8.1: Test idea generation Act as a conversion rate optimization expert. Here is information about my landing page: [paste page copy, describe layout, and include key metrics such as traffic, conversion rate, and device split]. Here is qualitative feedback from customers: [paste]. Generate 15 A/B test ideas. For each, write a hypothesis in the format “Because we observed X, we believe Y will cause Z,” and score it using the ICE framework (Impact, Confidence, Ease, each 1 to 10). Sort by total ICE score.
Prompt 8.2: Test result analysis I ran an A/B test. Control: [visitors] visitors, [conversions] conversions. Variant: [visitors] visitors, [conversions] conversions. The test ran for [days] days. Calculate the conversion rate for each, the relative lift, and whether the result is statistically significant at 95% confidence, showing your method. Then tell me what I should and should not conclude, and recommend next steps. Use code to calculate if you can.
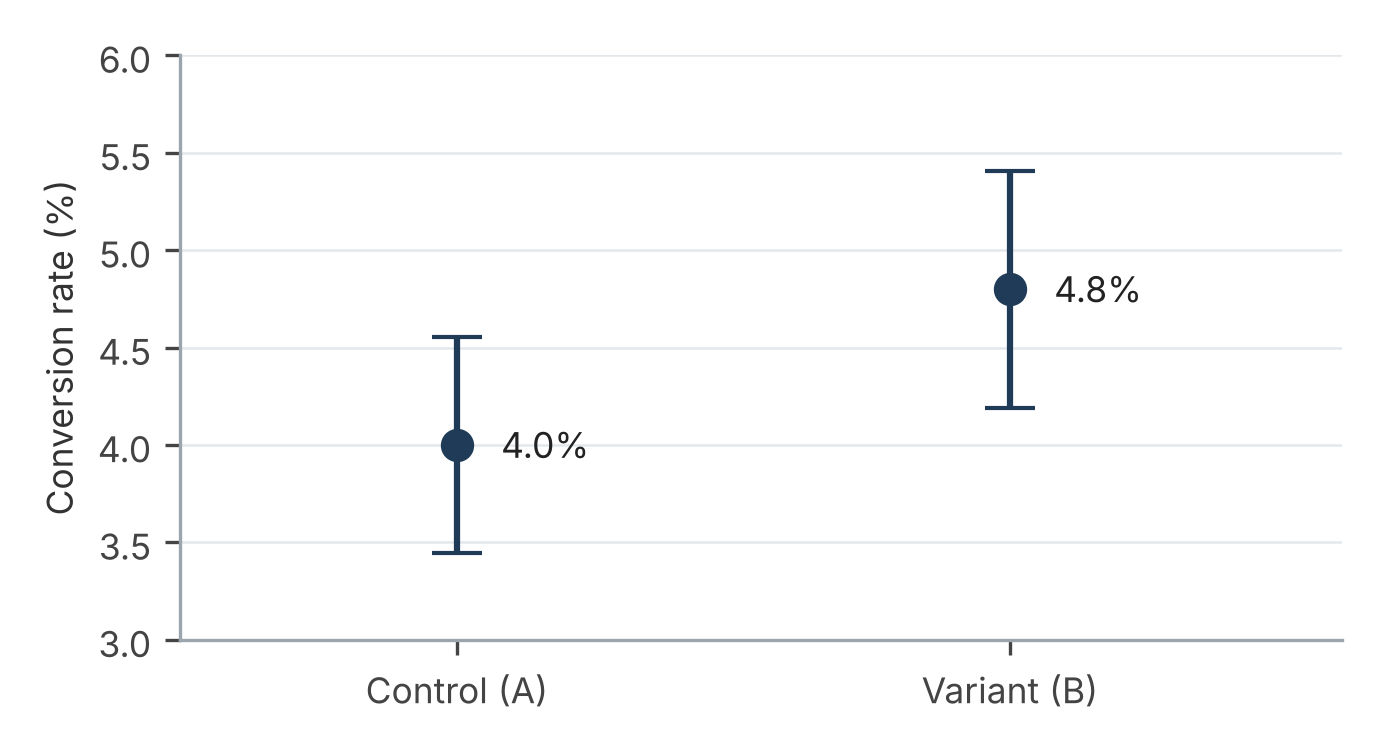
Figure 8.1: The variant looks better (4.8% vs 4.0%), but the 95% confidence intervals overlap, so the test needs more data (Exercise 8.3 numbers)
Toolkit: Record every experiment in the Test Log sheet, winners and losers alike.
Conversion rate optimization (CRO)
CRO is the systematic process of increasing the percentage of visitors who take a desired action. Because it improves the return on every channel at once, it is one of the highest-leverage skills in marketing. Doubling conversion rate halves your CPA across paid search, social, and email simultaneously.
The CRO process
- Research. Combine quantitative data (GA4 funnels, landing page reports, device breakdowns) with qualitative data (session recordings and heatmaps from tools like Microsoft Clarity, which is free, or Hotjar; on-site surveys; customer interviews; support tickets; reviews).
- Identify friction and leaks. Where are people dropping off, and why?
- Prioritize using a framework such as ICE or PIE (Potential, Importance, Ease).
- Test the most promising hypotheses.
- Learn and iterate. Document every test, winner or loser, in a shared log. Losing tests teach as much as winners.
Landing page principles
- Clarity beats cleverness. Within five seconds, a visitor should understand what you offer, who it’s for, and why it’s better.
- Message match. The headline should echo the ad or email that brought them.
- One page, one goal.
- Benefits before features, with features as proof.
- Social proof: reviews, ratings, customer counts, testimonials, recognizable logos, press.
- Risk reversal: guarantees, free returns, cancel anytime, free trials.
- Reduce friction: fewer form fields, guest checkout, multiple payment options (including digital wallets), clear shipping costs early.
- Address objections in FAQs near the call to action.
- Speed: every additional second of load time costs conversions, especially on mobile.
- Accessibility: readable contrast, alt text, keyboard navigation, and clear labels widen your audience and are increasingly a legal requirement.
Prompt 8.3: Landing page critique Act as a CRO consultant. Here is the full text of my landing page in order, plus a description of images and buttons: [paste]. The page’s goal is [goal] and visitors arrive from [source] after seeing [ad or email message]. Evaluate the page against these criteria: clarity of value proposition, message match, social proof, objection handling, friction, and call to action. Give a score out of 10 for each with specific improvement suggestions, and rewrite the headline and subheadline in three different ways.
Common analytical mistakes
Avoid these traps, and you will be ahead of many experienced marketers.
- Confusing correlation with causation. Sales rose after the new campaign launched, but so did the season. Use control groups and year-over-year comparisons.
- Ignoring seasonality. Compare to the same period last year, not just last month.
- Averages that hide the story. A 2% overall conversion rate might be 4% on desktop and 1% on mobile. Always segment.
- Simpson’s paradox. A trend that appears in several groups can reverse when the groups are combined. Segment before concluding.
- Small samples. Ten conversions are not a trend. Be cautious with small numbers.
- Survivorship bias. Analyzing only customers who stayed tells you little about why others left.
- Moving goalposts. Choosing the success metric after seeing the results. Define success before launching.
- Trusting platform numbers blindly. Each ad platform reports in its own favor. Reconcile with GA4 and back-end sales.
- Reporting without recommending. Data without a “so what” wastes leaders’ time.
Reporting that drives decisions
The structure of a great report
Use the “What, So What, Now What” framework:
- What happened? The key numbers versus target and prior period.
- So what? Why it happened and why it matters to the business.
- Now what? The actions you recommend, with expected impact and any decision needed from the reader.
Tips for presenting data
- Lead with the conclusion. Executives read the first line and decide whether to continue.
- One message per chart. Title each chart with its insight (“Mobile conversion fell 18% after checkout redesign”) rather than its contents (“Conversion rate by device”).
- Choose the right chart. Lines for trends over time, bars for comparing categories, tables when exact values matter. Avoid 3D charts and pie charts with many slices.
- Show context. Targets, previous periods, and benchmarks turn numbers into meaning.
- Be honest about uncertainty. “Early signal, not yet significant” builds more trust than overstated certainty.
- Keep it short. A one-page weekly report and a 10-slide monthly review beat a 40-slide data dump.
Reporting cadence
- Daily: automated alerts for anomalies (spend spikes, tracking breaks, traffic drops). No one needs a daily report.
- Weekly: channel KPIs versus target, key actions taken, next week’s priorities.
- Monthly: business KPIs, channel performance, test results, insights, and budget recommendations.
- Quarterly: strategy review, goals for next quarter, and resource requests.
Prompt 8.4: Monthly report draft Act as a marketing analytics lead. Using the data below, write a monthly marketing performance report for our leadership team using the What / So What / Now What structure. Include: a three-sentence executive summary, a KPI table versus target and last month and the same month last year, the top three wins and top two concerns with explanations, test results, and five prioritized recommendations with expected impact. Data: [paste]. Do not invent any numbers not in the data; if something is missing, list it as an open question.
Prompt 8.5: Anomaly investigation Our organic traffic dropped 25% week over week starting [date]. Walk me through a structured investigation checklist, from most likely to least likely causes, including tracking issues, technical SEO changes, algorithm updates, seasonality, AI Overviews impact, and site changes. For each, tell me where to look and what evidence would confirm or rule it out.
Hands-on exercises
Exercise 8.1: Metrics hierarchy (30 minutes). Build a four-level metrics hierarchy for Brightleaf, from North Star to diagnostics, with at least three metrics at each lower level.
Exercise 8.2: Hypothesis writing (30 minutes). Visit any e-commerce product page. Identify three points of friction. Write a formal hypothesis for each using the template in this chapter.
Exercise 8.3: Significance practice (20 minutes). Use Prompt 8.2 with these numbers: Control 4,800 visitors and 192 conversions; Variant 4,750 visitors and 228 conversions. Then check the result with a free online A/B test significance calculator. Do they agree? (Answer: the control converts at 4.0% and the variant at 4.8%, a 20% relative lift, but a standard two-sided test gives a p-value of roughly 0.06. That is close, yet not significant at 95% confidence. A promising result like this calls for more data, not a victory announcement.)
Exercise 8.4: Heatmap analysis (45 minutes). Install Microsoft Clarity (free) on a site you control, such as a personal portfolio, or watch Clarity’s public demo materials. Note three behaviors you would not have discovered from GA4 alone.
Exercise 8.5: Chart makeover (30 minutes). Find a cluttered chart in a public report. Redesign it with an insight title, a single message, and an appropriate chart type.
Strategic assignment: CRO audit and monthly report
Part A: CRO audit. Audit a landing page or checkout flow (for your business or a public site). Deliver: a research summary (quantitative and qualitative observations), a friction list, 10 prioritized test ideas with ICE scores, two fully specified test plans (hypothesis, primary and guardrail metrics, sample size estimate, duration), and a mock-up or written description of the variant for your top idea.
Part B: Monthly performance report. Using GA4 demo account data, produce a monthly report with an executive summary, KPI table, insights, and recommendations, following What / So What / Now What. Present it as a five-minute recorded video walkthrough: this is a strong portfolio piece because it shows communication skills as well as analysis.
Key takeaways
- Build a metrics hierarchy and drill down from KPIs to diagnostics when something changes.
- Test hypotheses, not opinions. Define the primary metric, sample size, and duration before launch.
- CRO multiplies the return of every channel. Research, prioritize, test, and document.
- Segment everything, respect seasonality, and beware small samples.
- Report with What / So What / Now What. Lead with the conclusion and always recommend an action.

Author of four Opencart book.
The recent are Opencart 4 developer book and Opencart 4 user manual