Search Everywhere: Page Experience and Speed: Fixing Core Web Vitals
How to measure and fix Core Web Vitals (LCP, INP and CLS), speed up WordPress, and improve the page experience signals Google still uses in 2026.
 Rupak NepaliPublished Nov 14, 2026

This post is Chapter 6 of Search Everywhere: The Practical Guide to SEO, AEO and GEO, the free online edition. Chapter and appendix references link to the matching post.
Speed has been part of Google’s ranking systems for more than a decade, and since 2021 it has been measured through Core Web Vitals. Page experience is rarely the deciding factor between two pages of very different quality, but it acts as a tie-breaker between similar pages, it affects conversion rates directly, and slow or unreliable servers reduce how much search engines and AI crawlers fetch.
This chapter explains the metrics, the tools that measure them, and the fixes that matter most on WordPress and eCommerce sites.
Core Web Vitals
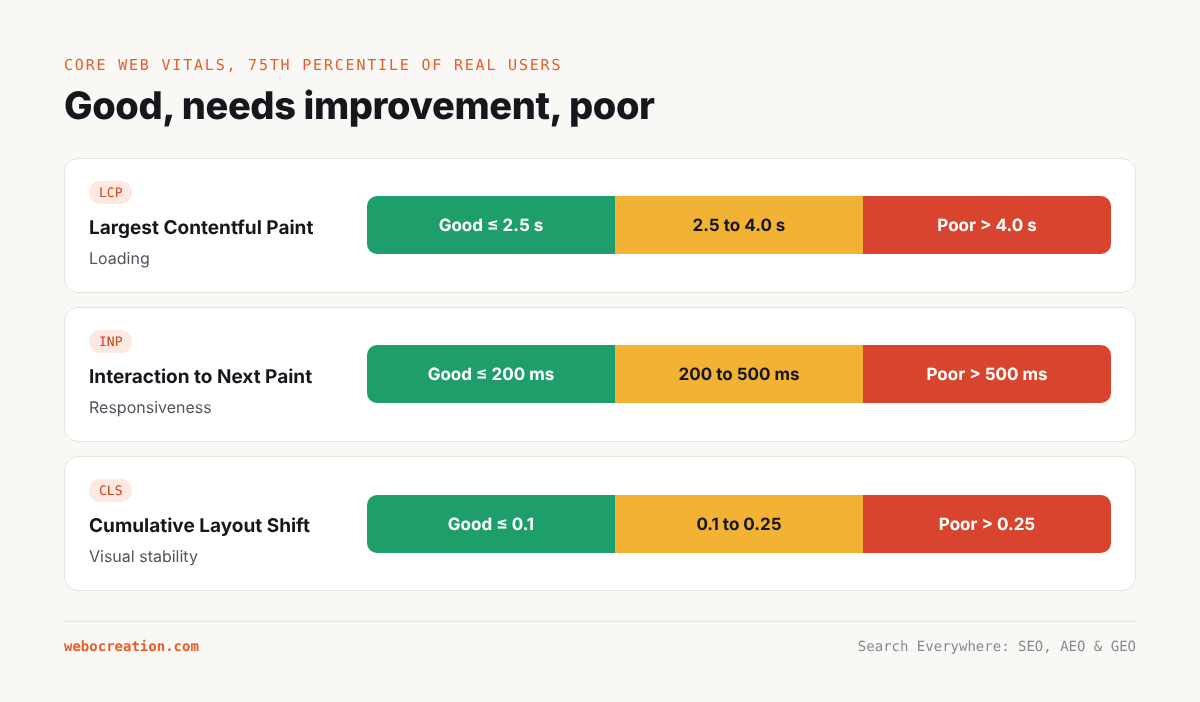
As of 2026 Core Web Vitals consist of three metrics, each measured at the 75th percentile of real user visits:
| Metric | What it measures | Good | Needs improvement | Poor |
|---|---|---|---|---|
| LCP (Largest Contentful Paint) | Loading: when the main content appears | ≤ 2.5 s | 2.5–4.0 s | > 4.0 s |
| INP (Interaction to Next Paint) | Responsiveness: delay between a user action and the next visual update | ≤ 200 ms | 200–500 ms | > 500 ms |
| CLS (Cumulative Layout Shift) | Visual stability: how much content jumps around | ≤ 0.1 | 0.1–0.25 | > 0.25 |
INP replaced First Input Delay (FID) in March 2024. It is a much stricter measure because it looks at all interactions during a visit, not just the first.
Field data versus lab data
This distinction causes more confusion than anything else in performance work.
- Field data (also called real user monitoring or RUM) comes from real visitors. Google’s source is the Chrome User Experience Report (CrUX), which collects anonymised data from Chrome users who have opted in. Core Web Vitals assessments in Search Console and the top section of PageSpeed Insights use field data. This is what Google uses for ranking.
- Lab data comes from a simulated load in a controlled environment, such as Lighthouse. It is useful for debugging because it is repeatable, but it does not represent real users. A Lighthouse performance score of 45 does not mean you fail Core Web Vitals, and a score of 98 does not mean you pass.
Low-traffic pages often have no field data of their own. In that case Google may group them with similar pages or use origin-level data.
The tools
PageSpeed Insights
PageSpeed Insights (pagespeed.web.dev) combines both kinds of data for a single URL:
- The top section, “Discover what your real users are experiencing”, shows CrUX field data for the URL and for the whole origin over the previous 28 days.
- The lower section runs Lighthouse and shows a lab performance score, the lab metrics, and a list of opportunities and diagnostics.
Always read the top section first. If field data passes, lab warnings are lower priority.
PageSpeed Insights also has a free API, which is useful for testing many URLs at once:
curl "https://www.googleapis.com/pagespeedonline/v5/runPagespeed?url=https://webocreation.com/&strategy=mobile&key=YOUR_API_KEY"Without an API key the API is heavily rate limited, so create a key in Google Cloud Console if you plan to run it regularly.
Case study note. When this book was written, the PageSpeed Insights API rejected anonymous requests from our research environment with a rate-limit error, so the scores below are illustrative. Run PageSpeed Insights on the homepage, a blog post and a service page to get the real figures.
Lighthouse
Lighthouse is built into Chrome DevTools (the Lighthouse panel) and also runs from the command line:
npx lighthouse https://webocreation.com/ --preset=desktop --output=html --output-path=./home.htmlBesides performance it audits accessibility, best practices and SEO. The SEO category checks basics such as the title, meta description, crawlable links, valid robots.txt and hreflang. A perfect Lighthouse SEO score is easy to achieve and says little about rankings, but a low one flags real problems.
Search Console Core Web Vitals report
This report groups your URLs into “Poor”, “Needs improvement” and “Good” for mobile and desktop, based on CrUX. It works with groups of similar URLs, so one template problem shows up as hundreds of affected pages. After fixing a problem, use “Validate fix” to start a 28-day monitoring period.
CrUX Dashboard and CrUX Vis
For trends over time, use the CrUX data directly. Google provides CrUX Vis (a web tool) and the CrUX API, and the full dataset is available in BigQuery. These let you track whether your origin’s LCP, INP and CLS are improving month by month.
Chrome DevTools Performance panel
When you need to find out why INP is slow, record a trace in the Performance panel while interacting with the page. Long tasks (over 50 ms) on the main thread are highlighted. The panel also shows live Core Web Vitals for your own browsing.
Other tools
- WebPageTest for detailed waterfalls, filmstrips and testing from many locations and devices.
- GTmetrix for a simpler combined report.
- The Web Vitals Chrome extension for live metrics while browsing.
- The web-vitals JavaScript library to collect field data from your own visitors and send it to GA4.
Illustrative example. A typical PageSpeed Insights result for a WordPress blog post on shared hosting with a page builder and several third-party scripts. Not webocreation.com/’s real data.
Mobile Desktop Field LCP (p75) 3.1 s (Needs improvement) 1.9 s (Good) Field INP (p75) 240 ms (Needs improvement) 90 ms (Good) Field CLS (p75) 0.04 (Good) 0.02 (Good) Lab performance score 54 88 Top opportunities Reduce unused JavaScript (GTM, chat widget), serve images in AVIF/WebP, eliminate render-blocking CSS, reduce server response time
Fixing LCP
LCP is the most commonly failed metric on mobile. The LCP element is usually a hero image, a featured image or a large heading. Break LCP into four parts and fix the biggest:
- Time to First Byte (TTFB). How long the server takes to respond. On WordPress, fix it with page caching (a caching plugin, server-level cache or edge caching through Cloudflare), a faster host, PHP 8.x with OPcache, and an object cache such as Redis for dynamic pages.
- Resource load delay. How long before the browser starts downloading the LCP resource. If the LCP image is set as a CSS background or lazy-loaded, the browser discovers it late. Use a normal
<img>tag, do not lazy-load the LCP image, and addfetchpriority="high". - Resource load time. How long the image takes to download. Compress it, serve AVIF or WebP, use
srcsetso mobile gets a smaller file, and use a CDN. - Element render delay. Time between the image arriving and it being painted, often caused by render-blocking CSS or JavaScript. Inline critical CSS, defer non-critical CSS, and defer or delay JavaScript.
<img src="/wp-content/uploads/2026/11/hero-800.avif"
     srcset="/wp-content/uploads/2026/11/hero-400.avif 400w,
             /wp-content/uploads/2026/11/hero-800.avif 800w,
             /wp-content/uploads/2026/11/hero-1200.avif 1200w"
     sizes="(max-width: 768px) 100vw, 800px"
     width="800" height="450"
     fetchpriority="high"
     alt="Cloudflare Turnstile widget on an OpenCart 4 contact form">
Fixing INP
INP problems come from JavaScript keeping the main thread busy when the user interacts. Common causes on WordPress and eCommerce sites:
- Heavy third-party scripts: tag managers loading many tags, chat widgets, heatmaps, A/B testing tools, social embeds, ad scripts.
- Page builders that ship large amounts of JavaScript.
- Expensive event handlers, such as add-to-cart buttons that trigger large DOM updates.
Fixes:
- Audit Google Tag Manager. Remove tags nobody uses. Fire non-essential tags after the page has loaded or on user interaction, not on page load.
- Delay third-party scripts until the user interacts (several WordPress performance plugins offer “delay JavaScript execution”).
- Break up long tasks in your own code using
setTimeout,requestIdleCallbackor thescheduler.yield()API, so that the browser can respond to input between chunks. - Avoid layout thrashing: batch DOM reads and writes.
- Use Partytown or a server-side tag manager to move some third-party work off the main thread or off the browser entirely.
Case study. webocreation.com/ loads Google Tag Manager, a Calendly booking widget linked from several places, and YouTube embeds on some pages. Calendly and YouTube can be loaded only when a user clicks (a “facade” pattern: show a static thumbnail or button and load the real embed on click). This is one of the cheapest INP and LCP wins available.
Fixing CLS
Layout shifts happen when content moves after it first appears. Causes and fixes:
- Images and videos without dimensions. Always set
widthandheightattributes (or CSSaspect-ratio) so the browser reserves space. - Ads, embeds and iframes that load late. Reserve space with a fixed-height container.
- Web fonts that cause text to reflow. Use
font-display: swapwith a fallback font that has similar metrics, orsize-adjustin@font-face, and preload the main font file. - Banners and cookie notices inserted at the top of the page. Overlay them instead of pushing content down.
Server and crawl performance
Speed matters to crawlers, not just users. Google’s crawl rate adapts to your server: if responses are fast and reliable, Googlebot crawls more. AI crawlers, some of which are aggressive, add load too. A few practices protect both:
- Use a CDN such as Cloudflare to cache static assets and, where possible, full HTML pages for anonymous visitors.
- Send correct caching headers (
Cache-Control,ETag,Last-Modified) so crawlers can use conditional requests and receive 304 responses. - Enable compression (Brotli or gzip) and HTTP/2 or HTTP/3.
- Monitor 5xx errors in Search Console’s Crawl stats report and in your logs.
- Rate-limit abusive bots at the edge rather than at the application.
Mobile-friendliness and other page experience signals
Google uses mobile-first indexing for all sites, meaning it primarily crawls and evaluates the mobile version. Make sure:
- The mobile version has the same content, headings, links and structured data as desktop.
- Text is readable without zooming and tap targets are large enough.
- There are no intrusive interstitials that cover the main content on arrival from search.
- The site uses HTTPS everywhere, with no mixed content.
Accessibility is not a direct ranking factor, but many accessibility practices overlap with SEO: descriptive alt text, logical heading order, meaningful link text, sufficient contrast and keyboard navigation. webocreation.com/ has published a guide to the European Accessibility Act for online stores, which makes accessibility a natural area to demonstrate on its own pages.
A performance workflow for WordPress
- Run PageSpeed Insights on one URL of each template: homepage, post, page, category, service page.
- Note field data first. Identify which metric fails on which template.
- Use the Lighthouse diagnostics and the DevTools Performance panel to find the cause.
- Fix at the template level, so one change improves hundreds of pages.
- Measure again in the lab immediately, then watch field data in Search Console and CrUX over the next 28 days.
- Set up the web-vitals library to send real user metrics to GA4 so you can see results faster and by page.
Key takeaways
- Core Web Vitals are LCP (≤ 2.5 s), INP (≤ 200 ms) and CLS (≤ 0.1), measured at the 75th percentile of real users.
- Field data (CrUX) is what counts for ranking. Lighthouse lab scores are for debugging.
- LCP fixes: faster server and caching, priority loading of the hero image, modern formats, less render-blocking code.
- INP fixes: fewer and later third-party scripts, shorter JavaScript tasks.
- CLS fixes: dimensions on media, reserved space for embeds, careful font loading.
- Fast, reliable servers get crawled more by search engines and AI crawlers.
Previous: Site Architecture, Internal Linking and Topical Authority
Next: Structured Data and Schema Markup: What Works in 2026
All chapters: Search Everywhere: The Practical Guide to SEO, AEO and GEO

Rupak Nepali is a web developer, manage Webocreation website and the author of six books:
Getting Started with OpenCart Module Development (Packt, 2013),
OpenCart Theme and Module Development (Packt, 2015),
OpenCart 4: Dev Guide for Themes & Extensions (2024),
OpenCart 4: User Manual (2025),
Cloudflare for the Enterprise Website (2026) and
The Technical Web Guide for Marketers (2026).
Rupak has built OpenCart stores and extensions since 2010, has published more than 600 tutorials on Webocreation, and shares free OpenCart extensions on GitHub.
Find Rupak on
GitHub | Amazon | LinkedIn | X | YouTube.