Windows Fundamentals and Architecture

0

We are going to understand Windows Architecture, Threads and Multitasking, Threads, Messages, and Message Queues, How does the Virtual Memory System work?

Chapter 1: Windows Fundamentals and Architecture

When you develop Windows-based applications, you can choose from a wide variety of programming environments depending on the requirements of your application. Many developers are choosing the C++ language for developing Windows-based applications because it is object-oriented in nature and provides a simplified approach to dealing with the complexity of Windows and the wide range of application programming interface (API) functions. Using C++, combined with a class library, further simplifies the development process by grouping the API functions into logical units and encapsulating the basic behavior of windows and other objects in reusable classes.

This course focuses on the Microsoft Foundation Class (MFC) Library, the class library created by Microsoft to be used in combination with Visual C++, the Microsoft version of C++. You can use these tools together to develop Windows-based C++ applications.

MFC extends the object-oriented programming model used in Windows-based applications. Since MFC is based on the Windows programming model, you need a basic understanding of Windows architecture before learning how to use the classes in your applications. If you’re coming to MFC from a traditional Windows programming background, such as C and the Windows SDK, you’re already familiar with these concepts. If you’re new to Windows programming, then this chapter is for you.

This chapter provides an overview of the Windows programming architecture and briefly takes you behind the scenes to see how Windows-based applications work.

Objectives

At the end of this chapter, you will be able to:

  • Define processes, threads, and multitasking.
  • Describe the structure of memory management.
  • Explain the purpose of messages and the concept of event-driven programming.
  • Describe the minimum components of a simple Windows-based application.
  • Explain how an application is initialized and windows are created.

Understanding Windows Architecture

Before you begin writing MFC applications, you should understand several key architectural features of Windows-based applications and the Windows operating system.

This section explains the run-time structure of Windows-based applications. Here you will learn about the differences between applications, processes, and threads of execution. You will also learn about how the Windows operating system manages processes and threads in order to maximize performance.

This section includes the following topics:

Processes

The term “process” and the more common term “application” are sometimes used interchangeably. However, in the Windows environment, there is a distinction between a process and an application.

An application is a static sequence of instructions that make up an executable file. A process is usually defined as an instance of a running application. A process has its own private address space, contains at least one thread, and owns certain resources, such as files, allocated memory, and pipes.

A process consists of:

  • An executable program
  • A private address space in memory
  • System resources, such as files, pipes, communications ports, and semaphores
  • At least one thread, where a thread is a path of execution
  • The Virtual Memory System

In an operating system where multiple processes are allowed, each process must be protected against corruption by other processes in memory. The Windows operating system is designed to provide this protection.

There are two types of memory in the Windows operating system:

Physical memory

Consists of the amount of physical RAM.

Virtual memory

Consists of 4 gigabytes (GB) of addresses, or 232 bytes of addressable memory that is available to your application. This is not 4 GB of actual physical memory. Each application is given 2 GB of addresses while the operating system reserves 2 GB for its own use.

Note  In Windows NT, an application may have up to 3 GB of addresses for its own use.

How does the Virtual Memory System work?

When an application is started, the following process occurs:

  1. The operating system creates a new process. Each process is assigned 2 GB of virtual addresses (not memory) for its own use.
  2. The virtual memory manager maps the application code into a location in the application’s virtual addresses, and loads currently needed code into physical memory. (The virtual address has no relationship to the location of the application code in physical memory.)
  3. If your application uses any dynamic-link libraries, the DLLs are mapped into the process’s virtual address space and loaded into physical memory when needed.
  4. Space for items such as data and stacks is allocated from physical memory and mapped into the virtual address space.
  5. The application begins execution by using the addresses in its virtual address space, and the virtual memory manager maps each memory access to a physical location.

The application never directly accesses physical memory. The virtual memory manager controls all access to physical memory through requests for access by using virtual addresses.

To see an animation that explains how virtual memory and physical memory work, click this icon.
Benefits of Using a Virtual Memory System

A virtual memory system helps both to ensure robust application execution and to simplify memory management.

As mentioned earlier, one concern about running an application in a multitasking environment is protecting that application’s execution from intrusion by other applications. Forcing applications to use virtual memory allows the operating system to provide strict physical memory partitioning between applications. If an application requests private memory space, the operating system will provide a map between that application and physical memory.

Virtual memory also allows applications to view memory as a flat, 2 GB of memory space without having to contend with the physical memory management architecture that is used by the operating system.

Threads and Multitasking

While a process can be thought of as a task that the operating system must perform, such as running a spreadsheet application, a thread represents one of the possibly many tasks needed to accomplish the job. For example, controlling the user interface, printing, and calculating the spreadsheet may be tasks of the spreadsheet application that are assigned to individual threads. A thread runs in the address space of its process and uses the resources allocated to its process.

A process can have a single thread, or it can be “multithreaded”. A multithreaded process is useful when a task requires considerable time to process. The task can run within one thread, while another task runs within a separate thread. The threads can be scheduled for execution independently on the processor, which allows both operations to appear to occur at the same time. The benefit to the user is that work can continue while the first thread completes its task. Another benefit is that on a multiprocessor system running Windows NT, two or more threads can run concurrently, one on each processor.

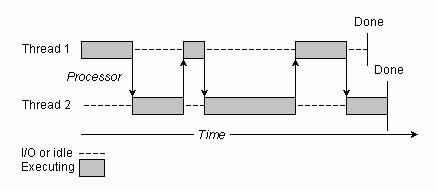
Multitasking is the ability of an operating system to give the appearance of the simultaneous running of multiple threads. The operating system achieves multitasking by allowing each thread to be active for a relatively short amount of time (tens of milliseconds) and then switching to the next scheduled thread. This process, called “context switching”, is done by:

  1. Running a thread until the thread’s time slot is exhausted or until the thread must wait for a resource to become available.
  2. Saving the thread’s context.
  3. Loading another thread’s context.
  4. Repeating this sequence as long as there are threads waiting to execute.

To see an illustration of context switching in a multitasking operating system, click this icon.

context switching in a multitasking operating system

Threads, Messages, and Message Queues

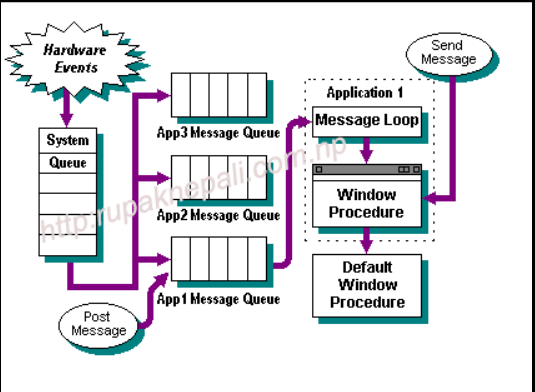
Each thread of execution has its own virtual input queue for processing messages from hardware, from other processes, or from the operating system. These queues operate asynchronously — that is, when one process posts a message to another thread’s queue, the posting function returns without having to wait for the other thread to process the message. The thread that has received the message can access and process the message when it is ready.

Of special interest is the handling of keyboard and mouse events. A special system thread, known as the raw input thread (RIT), receives all key and mouse events. Whenever the RIT receives hardware events from the processor, its sole function is to place them on the virtual input queue of the appropriate thread. Thus, under normal circumstances, no application thread need wait for its hardware events.

To see an animation that shows how messages are handled by the system message queue, click this icon.

Event-Driven Programming

Central to understanding how Windows-based applications work is the concept of event-driven programming. To hear an expert in the field describe event-driven programming, click this icon.

The best way to understand event-driven programming is to contrast it with the procedural programming of MS-DOS. Under MS-DOS, users enter command-line parameters in order to control how an application runs. Under Windows, users start the application first, and then Windows waits until users express their choices by selecting items within a graphical user interface (GUI). A Windows-based application thus starts and then waits until the user clicks a button or selects a menu item before anything happens. This is known as event-driven programming.

Questions Collection of Digital Economy

1

This is the collection of the common questions of Digital Economy that we mostly get in the exam of Bachelor of Computer Information system.

  1. a) What is knowledge management? Explain the framework for developing a knowledge management program. (8)
    b) Define e-Governance. Explain the levels of e-Governance Maturity Model. (7)
  2. State the use of the business model. Explain the issues to be addressed by a business model and their respective components. (15)
  3. Write short notes on any two: (2*5=10)
    roots of knowledge management
    features of e-Commerce technology
    layers of internet economy
  4. a) What is Secure Electronic Transfer. Explain the steps involved in the SET transaction. (8)
    b) What is the value chain? Explain Porter’s Generic value chain. (7)
  5. What is understood by value proposition? Explain in details the attributes that characterize value proposition. (15)
  6. Write short notes on any two: (2*5=10)
    a) Broadband
    b) Features of SET
    c) Digital convergence

(Questions for reference only)

BCIS Digital Economy

a) Explain how knowledge has become the fourth factor of production.

b) Explain e-Governance as a means of governance reform and outline its scope

a) What is meant value chain? How can  IT contribute to improving value chain efficiency?

b) Explain the term CRM and explain why firms invest in CRM

a) Explain e-Governance maturity model
b) What is open source movement? Explain how developing countries stand to benefit from it

c) Explain the term broadband and list down 3 major broadband technologies.

b) What do you understand by the term ‘knowledge economy’ and what are its key enabling elements?

a) What is e-commerce? List out its typologies (types) and distinguish between e-commerce and e-business?

b) What is your opinion are the limitations for the growth of B2C e-Commerce in Nepal?

a) What is meant by Knowledge Management?

Explain the significance of Knowledge management in organizations

b) What is VoIP? Explain benefits and challenges of VoIP and discuss in favor or against of legalizing VoIP

7. Write short notes on (any two):

a)Venture capital

b)Open Source

c)Digital convergence

d) Supply chain

BCIS: Digital Economy

  1. a)  Explain how knowledge has become the fourth factor of production.
    b)  Explain e-Governance as a means of governance reform and outline its scope
    c)  What is meant by value chain? How does e-commerce contribute to improving value chain efficiency?
    d)  Explain the term value proposition with examples
    e)  Explain e-Governance maturity model
  2. What is the open-source movement? Explain how developing countries stand to benefit from it
  3. What is understood by e-readiness? List out some of the indicators used in e-readiness assessments and its significance in IT policy formulation
  4. What do you understand by the term ‘knowledge economy’ and what are its key enabling elements?
  5. What is e-commerce? List out its topologies and distinguish between e-commerce and e-business?
  6. What is your opinion are the limitations for the growth of B2C e-Commerce in Nepal?
  7. What is BPO? Explain BPO with examples and outline international trends in BPO with special reference to India
  8. What is VoIP? Explain benefits and challenges of VoIP and discuss in favor or against of legalizing VoIP
  9. Write short notes on (any two):
  • Venture capital
  • Open Source
  • Digital convergence
  • Unified Messaging System
  • Explain what is meant by e-Governance and list key elements of e-Governance maturity model (EGMM)
  • Scope of e-Governance
  1. What are the limitations for the growth of B2C e-Commerce?
  2. What is BPO? Explain BPO with examples and outline international trends in BPO with special reference to India
  3. What is VoIP? Explain benefits and challenges of VoIP and discuss  in favor or against of legalizing VoIP
  4. Explain what is meant by e-Governance and list key elements of e-Governance maturity model (EGMM)
  5. What is the difference between VoIP and IP telephony?
  6. Write short notes on two of the following
    a)Unified  Messaging System b) Value chain c) Supply chain
  7.  What do you understand by the term ERP? Explain the benefits that ERP systems offer to the organization as well as challenges in ERP implementations
  8. Explain the term CRM and explain why firms invest in CRM?
  9. Explain how internet bandwidth will become a crucial issue in the days to come for the development of the ICT sector in the country
  10. Explain the term broadband and list down 3 major broadband technologies.
  11. What is understood by e-readiness? Explain in detail the significance of e-readiness assessment surveys in IT policy formulation.
  12. Explain the major features of Nepal’s IT policy and strategies.
  13. Explain what value proposition in your opinion could the IT park in Banepa offer to potentials IT firms wishing to locate their operations in the park.
  14. a. Define Knowledge Management and Knowledge Economy. Explain the four pillars of the Knowledge Economy.
  15. Explain the benefits of e-Governance and outline its scope.
  16. Define e-commerce and explain the features if e-commerce technology.
  17. What, in your opinion, are the factors, limiting the growth of B2C in Nepal.
  18. Explain the elements of e-business model that a firm can pursue in order to operate successfully in the Internet era.
  19. What is understood by the value chain and explain how firms can gain competitive advantage through the value chain.
  20. Define Broadband along with its benefits and explain its role in the economic development of a nation.
  21.  Define ERP and explain why firms undertake ERP. Outline some of its limitations.
  22. Define CRM. Give reasons as to why firms today should invest in CRM.
  23. Define the value proposition. What according to you is the value proposition offered by IT Park in Banepa to IT professional and IT firms in Nepal?
  24. Discuss some of the policies and strategies outlined in IT Policy of Nepal.
  25. Write short notes on any two: (5*2)
    1. Venture Capital
    2. Internet Economy
    3. VoIP
    4. OSS/FS

Control of Diarrhoeal Diseases

0

Control of Diarrhea Diseases 

1          BACKGROUND

Recognizing diarrhea diseases as one of the major public health problems among children under five in Nepal, the National Control of Diarrhea Diseases Program (NCDDP) has been accorded high priority status by GON and is an integral part of Primary Health Care.

Improvement in diarrhea case management has been used as a primary strategy for the reduction of mortality due to diarrhea among children under five years of age.  Standard diarrhea case management are provided in the health institutions by establishing Oral Rehydration Therapy (ORT) corners in all Hospitals, Primary Health Care Centers, Health Posts and Sub Health Posts throughout the country.  All health facilities and community health volunteers serve as the primary health service providers in the treatment of Diarrhea with Oral Rehydration Solutions (ORS) which is free of cost.

1.1       OBJECTIVES

The main objective of the National Control of Diarrhea Diseases Program (NCDDP) is to reduce mortality due to diarrhea and dehydration (from the estimated 30,000 deaths per year in the past) to a minimum, and to reduce morbidity from 3.3 episodes per child per year to a minimum.

1.2       TARGETS

1.2.1    To reduce the under-five mortality rate due to diarrhea by 50 percent by 2005/2006;

1.2.2    To reduce the under-five morbidity rate due to diarrhea by 20 percent by 2005/2006;

1.2.3    To increase the accessibility of Oral Rehydration Solution (ORS) to 100 percent of the population by 2005/2006;

1.2.4    To raise public awareness about the correct preparation and use of Oral Rehydration Solution in the treatment of diarrhea, and increase use of ORS by 20 percent by 2005/2006; and

1.2.5    To increase the proportion of caretakers that provides ORT for children with diarrhea to 40 percent by 2005/2006.


1.3       Indicators

Main Indicators Numerator and Denominator
1.             Morbidity rate due to diarrhea Total diarrhea new cases in specified time                         x 1000
Target population (under-fives)
2.             Mortality rate due to diarrhea Total number of diarrhea-related deaths                            x 1000
Target population (under-fives)
3.             Case fatality rate from diarrhea Total diarrhea deaths per year                                             x 1000
Total diarrhea new cases in same period


1.4       STRATEGIES


General Strategies

  • 4.1        Establish functioning ORT Corners and replenish ORT Corner sets in each health facility in order to educate mothers/caretakers, to demonstrate proper ORS preparation, and to treat children suffering from diarrhea;
  • 4.2    Increase access to Oral Rehydration Solution packets through FCHVs, SHPs, HPs, PHCCs, hospitals and commercial outlets;
  • 4.3    Raise public awareness;
  • 4.4        Promote specific preventive measures through communication and information activities;
  • 4.5    Involve Community Health Workers including the volunteers (VHWs, MCHWs and FCHVs), District Development Committee (DDC) and VDC members, local NGOs and local decision-makers;
  • 4.6    Apply an integrated child health package including the CDD, EPI, Nutrition, Acute Respiratory Infection (ARI) and Malaria programs; and
  • 4.7    Emphasize program management at all health facilities.


Strategies for Tenth Five Year Plan

  • 4.8    Train all levels of health workers including VHWs/MCHWs/FCHVs/community leaders;
  • 4.9    Orient community opinion leaders, VDC members, faith healers;
  • 4.10 Supply Oral Rehydration Solution to all health institutions;
  • 4.11 Supply Oral Rehydration Solution to all FCHVs;
  • 4.12  Develop health education materials (including development and printing of IEC materials) to be used by mothers, FCHVs, and through channels of radio and TV communication;
  • 4.13  Promote supervision and monitoring at all levels; and
  • 4.14  Promote “Knowledge, Attitude and Practice” (KAP) on CDD among health workers, mothers and FCHVs

2          ANALYSIS OF ACHIEVEMENTS BY MAJOR ACTIVITIES

2.1       ACTIVITIES CARRIED OUT IN FY 2062/63 (2005/2006)

2.1.1    Planning

  • District-level planning and orientation was conducted for District Health Officers (DHOs), Public Health Officers (PHOs), and other health personnel including DDC members and local decision makers in Sankhuwasabha, Sindhuli, Udayapur, Gorkha, Parbat, Kapilvastu, Surkhet and Jumla districts.

2.1.2    Supply of ORS

  • 2,500,000 sachets ORS purchased and distributed to the districts.

2.1.3    Communication and Training Materials

  • Revised and finalized training materials and printed through WHO and GoN.

2.1.4    Transportation

  • Supply of IEC materials regarding CDD to districts as requested.

2.1.5    Monitoring and Supervision

  • Supervision from center and region to districts accomplished
  • Supervision from district to PHCC, HP/SHP as per schedule done

2.1.6    Epidemic Control

  • Financial support to all districts provided where epidemic occurred


2.2              TARGETS vs. ACHIEVEMENT, FY 2062/63 (2005/2006)

S.

No.

Activities Unit Targets Achievement Targets vs.

Achievement (percent)

1. Purchase of ORS Pkts. 2,500,000 2,500,000 100
2. Printing of IMCI Register Pcs. 1,500 1,500 100
3. Printing of Mothers’ Card Sheets 10,000 10,000 100
4. Printing of CB-IMCI Training Materials Pcs. 2,800 2,800 100
5. CB-IMCI Drugs freq 1 1 100
6. Counselling Service (CB-IMCI Program for 10 Districts) freq 2 2 100
7. Treatment of <5 Diarrhea Cases Cases 628,573 739,915 100

Source: HMIS/MD & IMCI Section/CHD, DoHS


As can be seen from the above table, all CDD targets were achieved satisfactorily during FY 2062/63. The overall achievement was 100 percent.


Table 2c.1       ORS Supply, Three-Year Comparison, FY 2060/61 to 2062/63

Year Targets Achievement Achievement percent
2060/61                                2003/2004 2,000,000 2,000,000 100%
2061/62                                2004/2005 2,000,000 2,000,000 100%
2062/63                                2005/2006 2,500,000 2,500,000 100%

Source: IMCI Section/CHD, DoHS


Table 2c.1 shows the trend of Oral Rehydration Solution supply to the districts from FY 2060/61 to 2062/63.  The CDD program provided ten packets of ORS to each FCHV according to the CDD National Policy. Those ten packets were replenished whenever FCHVs used all on treatment of diarrhea in under-five children. During the FY 2060/61, 2061/62 and 2062/63 the target vs. achievement was 100 percent.  Figure 2c.3 and Table 2c.1 for FY 2062/63 is based on the report received from the Finance Section, DoHS.

2.3              ANALYSIS OF SERVICE STATISTICS

Table 2c.2 below shows the decreasing trend in the number of diarrhea visits for the last two years compared to FY 2060/61.  In FY 2062/63, the total number of diarrhea visits decreased remarkably in comparison to FY 2060/61 and 2061/62. Diarrhea deaths in FY 2062/63 have decreased by 66.4% in comparison to FY 2061/62 and 57.7% to 2060/61. The national reported incidence of diarrhea per 1,000 among children under five years also decreased in FY 2062/63 in comparison to FY 2060/61 and 2061/62. The reported incidence of diarrhea at the regional level also decreased in all the development regions. At national level, the case fatality rate has decreased significantly (0.11/1,000) in the FY 2062/63 compared to FY 2060/61 and 2061/62. The reason for this decreasing trend in the visits for diarrhea, deaths and incidence and case fatality rate may be due to rapid expansion of CB-IMCI Program.


Table 2c.2       Incidence of Diarrhea, by Region, FY 2060/61 to 2062/63

Indicators Year Region  National
 EDR  CDR  WDR  MWDR  FWDR
Total <5 Populationfor CDD/ARI 2062/63 796,079 1,202,989 725,133 524,860 384,625 3,633,687
Total diarrheaVisits 2060/612061/622062/63 2003/04

2004/05

2005/06

234,206

230,320

221,757

253,588

249,003

229,268

121,327

128,644

113,459

103,451

106,297

104,234

74,522

71,072

71,197

787,094

785,336

739,915

Total diarrheaDeaths 2060/612061/622062/63 2003/04

2004/05

2005/06

23

24

11

50

56

20

26

20

3

63

107

39

32

37

9

194

244

82

Incidence ofdiarrhea /1,000<5 yrs. Popn. 2060/612061/622062/63 2003/04

2004/05

2005/06

302

294

279

216

209

191

171

179

156

202

205

199

199

187

185

222

219

204

Case Fatality Rate/ 1,000<5 yrs. Popn. 2060/612061/622062/63 2003/04

2004/05

2005/06

0.1

0.1

0.05

0.2

0.2

0.09

0.2

0.2

0.03

0.6

1.0

0.37

0.4

0.5

0.13

0.2

0.3

0.11

Source:  HMIS/MD, DoHS


Figure 2c.4 shows the three-year trend of reported diarrhea incidence per 1,000 under-five children.  At the national level during FY 2062/63, incidence of diarrhea decreased slightly, (204 per 1,000) compared to FY 2060/61 and 2061/62. At regional level also diarrhea incidence has decreased in all regions in FY 2062/63 in comparison to FY 2060/61 and 2061/62.


Figure 2c.5 shows the three-year trend of reported diarrhea deaths. In FY 2062/63 the total number of diarrhea deaths decreased by 66.4% in comparison to FY 2061/62 and by 57.7% compared to FY 2060/61. Similarly, at regional level also the diarrhea deaths decreased by more than 50 percent in comparison to FY 2060/61 and 2061/62. Amongst the five development regions the highest number of diarrhea deaths occurred in the MWDR (39) followed by CDR (20) and the lowest number occurred in the WDR (3) in FY 2062/63.


Table 2c.3       Classification of Dehydration, by Region, FY 2060/61 to 2062/63

Indicators Year Region National
EDR CDR WDR MWDR FWDR
Total cases 2060/612061/622062/63 2003/04

2004/05

2005/06

234,206

230,320

221,757

253,588

249,003

229,268

121,327

128,644

113,459

103,451

106,297

104,234

74,522

71,072

71,197

787,094

785,336

739,915

No Dehydration Cases 2060/61 2003/04 110,764

47.3%

146,966

58.0%

80,141

66.1%

63,918

61.8%

47,726

64.0%

449,515

57.1%

2061/62 2004/05 114,888

49.9%

155,256

62.4%

88,256

68.6%

66,137

62.2%

46,449

65.4%

470,986

60.0%

2062/63 2005/06 127,884

57.7%

154,586

67.4%

81,938

72.2%

68,062

65.3%

48,660

68.3%

481,130

65.0%

Some Dehydration Cases 2060/61 2003/04 118,086

50.4%

100,715

39.7%

38,760

31.9%

34,921

33.8%

24,812

33.3%

317,294

40.3%

2061/62 2004/05 111,610

48.5%

89,176

35.8%

38,038

29.6%

35,144

33.1%

22,876

32.2%

296,844

37.8%

2062/63 2005/06 91,701

41.4%

72,407

31.6%

30,199

26.6%

33,113

31.8%

21,297

29.9%

248,717

33.6%

Severe Dehydration Cases 2060/61 2003/04 5,356

2.3%

5,907

2.3%

2,426

2.0%

4,612

4.5%

1,984

2.7%

20,285

2.6%

2061/62 2004/05 3,822

1.7%

4,571

1.8%

2,350

1.8%

5,016

4.7%

1,747

2.5%

17,506

2.2%

2062/63 2005/06 2,172

1.0%

2,275

1.0%

1,322

1.2%

3,059

2.9%

1,240

1.7%

10,068

1.4%

Source: HMIS/MD, DoHS


Table 2c.3 shows the classification of dehydration by region over the last three years. CDD reactivation, CBAC, and IMCI programs had positive impact on the skill and knowledge of health workers, enabling them to better identify various categories of classifications and treat them appropriately.  Because of their better skill and knowledge, more cases are gradually being classified as ‘No Dehydration’ and less cases as ‘Some Dehydration’.  Also because of increased awareness among caretakers, cases of diarrhea in children are brought to health facilities at an earlier stage. At the national level cases of ‘Severe Dehydration’ has gradually declined (2.6 percent, 2.2 percent and 1.4 percent) during the three fiscal years.  This decline in severe dehydration is observed in all regions in comparison to FY 2060/61 and 2061/62.


Table 2c.4       Treatment of Diarrhea Diseases, by Region, FY 2060/61 to 2062/63

Indicators Year Region National
EDR CDR WDR MWDR FWDR
Total cases 2060/612061/622062/63 2003/04

2004/05

2005/06

234,206

230,320

221,757

253,588

249,003

229,268

121,327

128,644

113,459

103,451

106,297

104,234

74,522

71,072

71,197

787,094

785,336

739,915

Treated withORS 2060/612061/622062/63 2003/04

2004/05

2005/06

192,352

188,410

176,215

233,303

230,052

212,912

114,664

121,641

107,050

88,973

89,188

89,267

67,968

64,540

63,727

697,260

693,831

649,171

88.6%

88.3%

87.7%

Treated withIV fluid 2060/612061/622062/63 2003/04

2004/05

2005/06

5,637

4,266

2,599

6,309

5,645

3,404

3,863

4,017

2,527

5,810

6,185

4,306

2,812

2,730

1,449

24,431

22,843

14,285

3.1%

2.9%

1.9%

Source:  HMIS/MD, DoHS


Table 2c.4 shows that, at the national level over the three fiscal years, treatment by IV fluid is gradually decreasing, whereas the percentage of ORS treatment in all three fiscal years remained almost the same. In FY 2062/63 1.4 % of cases were diagnosed as severe dehydration where as 1.9% were treated by IV Fluid. But this has been gradually improving over the years.

Figure 2c.6 shows a consistent seasonal variation in total diarrhea visits over the last three years.  Increases in diarrhea incidence starts from the month of Falgun and continues till Jestha, and then starts declining gradually. This sort of seasonal variation was observed during the last three fiscal years.

2.4       Recommendations

Based on field experience, the following strategies are to be improved and should be continued for a successful and effective implementation of program.

  1. A) Strategies to be modified
    1. IMCI approach
    2. Extension of community-based IMCI to FCHV and VDCs
  • Decentralized planning to promote district-level commitment and a feeling of program ownership and responsibility for effective program implementation
  1. Central level facilitators should be made available for each district-level training as well as for community-level program monitoring
  2. Focus on program management without neglecting case management
  3. B) Strategies to be improved
  4. Training allowances for VHWs, MCHWs, and FCHVs to be revised according to the level of status and allocated in central-level budget planning
  • FCHVs to be supervised/recognized by all levels to maintain high motivation
  • Motivation and follow-up mechanisms to be developed for VDCs to support FCHVs


3 PROBLEMS/CONSTRAINTS AND ACTIONS TO BE TAKEN

S. No. Problems/constraints Action to be taken Responsibilities Deadline
3.1 Inadequate ORS in some districts Increase budget for ORS for some districts. CHD As soon as possible
3.2 Inadequate budget for epidemics of diarrhea. Strict management and discipline over proper use of epidemic budget and increase budget. DHO/RHD and CHD As soon as possible


4          TARGETS FOR FY 2063/64 (2006/2007)

S. No. Activities Unit Annual Targets Budget Rs.’000
1 ORS purchase Pkts. 2,500,000 11,000
2 Treatment of <5 diarrhea cases Cases 628,573 1,177

Source: IMCI Section/CHD, DoHS

Note:    For detailed, district-specific data and analysis on this program/project, please refer to the annexes in this document.

Community Based Integrated Management of Childhood Illness (CB-IMCI)

0

Community Based Integrated Management of Childhood Illness (CB-IMCI)

1 BACKGROUND

In 1997, the CDD/ARI Section of the Child Health Division implemented the Integrated Management of Childhood Illness (IMCI), an integrated package of child-survival Program in Mahottari District as a pilot. It addresses five major killer diseases (diarrhea, pneumonia, malnutrition, measles, and malaria) in a holistic way. Based on the recommendations made in FY 2055/56, Program personnel and EDPs representatives decided to include a community component, enabling mobilization of community health workers (VHWs and MCHWs) and FCHVs to provide CDD, ARI, nutrition and Immunization services to the communities. As a result, the (CBAC) Program merged into IMCI in 1999 and is now called Community Based IMCI (CB-IMCI).

In the beginning CB-IMCI Program was implemented in Nawalparasi, Bardiya, and Kanchanpur districts in FY 2056/57 and gradually expanded to 25 districts of the country by the end of FY 2061/62 in a phased manner. In FY 2062/63 CB-IMCI was further expanded to 8 more districts (Udayapur, Sankhuwasava, Sindhuli, Gorkha, Parbat, Kapilvastu, Jumla and Surkhet) making the total of 33 districts. Out of the 33 districts, CB-IMCI is functional in HF and Community level in 22 districts and where as in 11 districts it is functional at HF level only.

Status of IMCI Training (FY 2062/63)

Districts Doctor Supervisors & others from DHO/ Hospital PHI Sr.AHW/

AHW

HA Staff

Nurse

ANM NGO &

others

Total
Surkhet 1 7 62 6 9 28 7 120
Kapilvastu 2 16 88 4 4 21 1 136
Gorkha 1 9 52 4 3 15 84
Udayapur 3 6 57 1 4 28 99
Sindhuli 1 14 58 8 2 10 1 94
Jumla 2 4 41 2 2 7 58
Parbat 5 1 2 53 3 2 13 5 84
Sankhuwasava 2 2 42 5 3 19 8 81
Total 17 57 4 453 33 29 141 22 756

During the FY 2062/63, 756 persons of various categories from eight districts were provided IMCI training. Sixty percent of those were Sr. AHW/AHW followed by ANMs and other categories. The categories of staff trained in IMCI is given in the above table.

Community level training

SN Activities Number of Participants Total
Parbat Sankhuwasabha Jumla Surkhet
1. FCHV 1st phase 494 311 527 876 2,208
2. VDC/HFOMC 557 373 234 515 1,679
3. Mothers€™ Group Orientation 9,702 3,913 4,806 10,655 29,076
4. FCHV 2nd Phase Training 474 300 506 1,280
5. Traditional Healers Orientation 197 103 111 411

Community level Training on IMCI by type of activities in four districts is given in the above table. More than 29,000 of mothers group have participated in the orientation Program. FCHV were provided training in two phases. Visualizing the important role played by the traditional healers, more than 400 traditional healers were also participated in the training program. For details see the above table.

Mothers’ Group Orientation

SN Activity Number of Participants Total
Parbat Sankhuwasabha Jumla Surkhet
1. Total # of Mothers attended 9,702 3,913 4,806 10,655 29,076
2. Total <5 cases examined 3,198 1,182 1,950 4,436 10,766
3. Total # of pneumonia cases treated 179 95 272 415 961
4. Total severe cases Referred to HF 21 13 119 79 232
5. Total ARI cases provided Home therapy 2,998 1,074 1,559 3,942 9,573

Source: IMCI Section

Impact of CB-IMCI Program

The figure 2c.1 shows the effectiveness of CB IMCI Program by comparing 3 key indicators of Diarrhea between 25 CB-IMCI districts and 50 non-CB-IMCI districts. The incidence of Diarrhea detection in 25 CB-IMCI districts is lower than those of 50 non-CB-IMCI districts. In the CB-IMCI districts out of total registered Diarrhea cases (373,888) only 1.4% are severe dehydration where as in non-CB-IMCI districts out of total registered cases (411,448) 3.0% are severe dehydration. This could be due to increased accessibility, availability of services as well as ORS packets at any time in the community, timely referral by FCHV and increased health facility use rate by the mothers/caretakers of <5 children.

Similarly, figure 2c.2 shows an impact of CB-IMCI Program by comparing 3 key indicators of ARI between 25 CB-IMCI districts and 50 non-CB-IMCI districts. The incidence and pneumonia detection in 25 CB-IMCI districts is higher than those of 50 non-CB-IMCI districts. In the CBIMCI districts out of total registered ARI cases (760,409) only 1.1% are severe where as in non-IMCI districts out of total registered ARI cases (530,223) 3.5% cases are severe. This could be due to increased accessibility, availability of services at any time in the community, timely referral by FCHVs and increased health facility use rate by the mothers/caretakers of <5 children.

Community-Based ARI and CDD (CBAC)

CDD reactivation was one of the most prominent Programs executed by the Child Health Division. It was designed to help health workers gain professional knowledge, skills, and attitudes regarding WHO standards for case management of diarrhea and acute respiratory diseases.

In FY 2055/56, it was renamed as the Community-based ARI and CDD (CBAC) Program, and combined two other child survival Programs-Nutrition and Immunization. The CBAC Program was implemented in FY 2055/56 in five districts: Siraha, Rautahat, Bara, Rasuwa and Bajura. It was expanded to 6 more districts in FY 2056/57. Out of 11 CBAC districts, 5 have already been converted to CB-IMCI districts and 3 more districts will be taken up this year.

The Program includes the following three main strategies of CDD, ARI, Nutrition and Immunization Programs: (1) recognition of the danger signs of diseases related to CDD, ARI, Nutrition and Immunization; (2) timely referral to nearby health facilities; and (3) improved community support for CDD, ARI, Nutrition and Immunization through group participation and Program management. Support and assistance from communities are encouraged through:

  1. a) Introduction to the Combined Child Health Package which includes instructional materials as well as supplies for CDD, ARI, Nutrition and EPI;
  2. b) Emphasis on CDD/ARI Program Management along with case management activities;
  3. c) Organization of district and VDC orientation Programs to encourage community involvement and active participation; and
  4. d) Specialized training for all community based health workers and volunteers (VHWs, MCHWs, and FCHVs) to reduce morbidity and mortality due to diarrhea diseases, acute respiratory infections, malnutrition, and vaccine-preventable diseases.


Prevention of malnutrition

0

2          ANALYSIS OF ACHIEVEMENTS BY MAJOR ACTIVITIES

2.1       Activities Carried Out in FY 2062/63

2.1.1        Prevention of malnutrition

2.1.2        Protection and promotion of breastfeeding/complementary feeding (Infant and Young Child Feeding – IYCF)

  • Developed and approved National Strategy for Infant and Young Child Feeding (an integral part of the comprehensive National Nutrition Policy and Strategy);
  • Celebrated Breastfeeding Week (August 1-7) in all districts with rallies, talk programmes, adolescent orientation and School health program etc;
  • Conducted one day orientation to HWs (including doctors, nurses and paramedics) in four teaching hospitals in Kathmandu valley;
  • Conducted survey on availability of breast milk substitutes at the local market of Kathmandu;
  • Developed promotional messages for exclusive breastfeeding through mass media and distributed of booklets on breastfeeding for health workers;
  • Conducted ToT and participant training on IYCF Counselling to HWs;
  • Conducted two-day IYCF orientation to all Nutrition Focal Persons and Health Education Technicians in five regions;
  • Developed a low cost fortified blended complementary food for social marketing campaign and its promotional materials designed and tested.

2.1.3              Growth monitoring for screening and prevention of PEM

  • Conducted regular growth monitoring at  Hospital, PHC, Health Posts, Sub Health Posts and Outreach clinics;
  • Distributed growth monitoring and counselling card;
  • Completed evaluation study of growth monitoring activities in selected health facilities of 4 districts in CDR in July 2004;
  • A booklet on measurement of mid-upper arm circumference (MUAC) was developed and distributed to all FCHVs throughout Nepal;
  • Mid-upper arm circumference (MUAC) measuring tapes (Shakir Tape) distributed to FCHVs.
  • Salter scales distributed to D(P)HOs;
  • Conducted orientation about proper method of growth monitoring practices and counselling activities to health workers including FCHVs in Syanja and Parbat districts;

2.1.4    Control of IDD

  • Finalised Iodised Salt Regulation and its implementing Guideline;
  • Conducted regular supervision and monitoring of iodized salt conducted at STC’s warehouses;
    • Iodized Salt Social Marketing Campaign V continued in Rupandehi, Kapilvastu, Nawalparasi, Dhanusha, Siraha and Dang districts;
    • IDD month celebrated throughout the country in the month of February for intensification of promotional activities;
    • Surveillance on consumption of iodized salt along with Vitamin A was continued by conducting a mini survey. FCHV registers used for Intensification of Antenatal Iron Supplementation Program (IAISP) was also used for this purpose;
    • Second edition of €œA booklet on Iodine Deficiency Disorders for health workers and program managers€ was published;
    • National scale survey for tracking the process towards prevention of iodine deficiency disorders in Nepal completed;
    • Renewed Indian Grant in IDD control program;
    • Published IDD calendar for community level for promotional activities.

2.1.5    Control of Vitamin A deficiency disorder

  • Continued mass biannual distribution of high-dose vitamin A capsules to children between 6 to 59 months throughout the country;
  • Continued nutrition education activities through media, community-level health workers and agriculture extension workers;
  • Conducted mini-surveys to assess the outreach supplementation programme;
  • Continued postpartum vitamin A supplementation through health institutions and FCHVs;
  • Continued pilot intervention for treatment of night-blind pregnant women with low dose vitamin A capsules in three districts;
  • Continued case treatment with vitamin A through health facilities;
  • Initiated community-based nutrition reactivation training to HWs with emphasis on Vitamin A in selected districts;
  • Conducted a workshop to revise IEC materials on nutrition, especially on Vitamin A;

2.1.6        Control of iron deficiency anaemia (IDA)

  • Continued distribution of iron and folate tablets to pregnant and lactating women through Hospital, PHCC, HPs, SHPs ORCs, and FCHVs;
  • Scaled up Intensification of Maternal And Neonatal Micronutrient Program (IMNMP) in 13 new districts (Rupendehi, Sarlahi, Rautahat, Jumla, Dailekh, Bardia, Doti, Baitadi, Kanchanpur, Kailali, Surkhet, Salyan, and Pyuthan);
  • Continued production of wheat flour fortified with iron, folic acid and vitamin A few mills on voluntary basis;
  • Received commitment of KfW to provide financial assistance to procure 40 million iron tablets for the fiscal year 2062/63;
  • Initiated advocacy on use of low cost iron tablets to pregnant and postnatal women attending Maternity Hospital in Kathmandu;
  • Conducted surveillance on consumption of iron along with Vitamin A mini survey continued during October and April rounds;

2.1.7    Deworming

  • Continued regular biannual deworming of children aged 1-5 years along with vitamin A capsule distribution;
  • Continued deworming of pregnant women as per the Policy and protocol;
  • Included reporting of deworming of pregnant women in HMIS;
  • Explore school Deworming program.

2.1.8    Miscellaneous

Developed National School Health and Nutrition Strategy.


General Strategies have been pursued to address the nutritional situation in Nepal

0

1.4       Strategies

The following general strategies have been pursued to address the nutritional situation in Nepal:

  • Promote, facilitate and utilise community participation and involvement in all nutrition activities;
  • Develop understanding and effective co-ordination among various concerned Sections, Divisions and Centres within the Department of Health Services;
  • Maintain and strengthen co-ordination among other agencies involved in nutrition activities, i.e., the Ministries of Agriculture, Education, Local Development and the National Planning Commission, as well as with international development partners, NGOs, INGOs and private sector;
  • Decentralise authority to the region, district, Health Post, Sub Health Post and community for needs assessment, planning, implementation, and monitoring;
  • Conduct national advocacy and social mobilisation campaigns;
  • Integrate/incorporate activities (such as Expanded Programme on Immunisation, Integrated Management of Childhood Illness, Maternal and Child Health and Family Planning programmes etc.) into nutrition plans;
  • Develop a systematic approach for monitoring and evaluation of all nutrition program activities;
  • Celebrate Nutrition week (Poush 10-16) to raise awareness about the importance of Nutrition;
  • Implement School Health and Nutrition Program as per National Strategy; and

Specific strategies are as follows:

1.4.1    Infant and Young Child Feeding (IYCF)

  • Create awareness regarding the importance of growth monitoring and timely introduction of complementary foods through Mothers Groups, radio, TV news and poster/pamphlets, and counsel mothers on growth-patterns and proper child caring practices;
  • Provide growth-monitoring services at Outreach Clinics, Sub Health Posts, Health Posts and PHCC;
  • Integrate breast-feeding training with growth monitoring promotion and link breastfeeding promotion with child care programmes;
  • Increase awareness among medical professionals through advocacy efforts, such as by including sessions on breastfeeding on seminars/workshops held by various associations;
  • Establish mother€™s groups support to protect existing good practices regarding breast-feeding at the community level;
  • Celebrate Breastfeeding Week (August 1-7) as an advocacy for the protection and promotion of breastfeeding;
  • Encourage social marketing of low cost fortified blended complementary food targeting infants and young children 6-23 months of age.

1.4.2        Control of IDD

  • Strengthen the implementation of Iodized Salt Act, 2055 for regulation and monitoring of iodized salt trade to ensure that all edible salt is iodized;
  • Increase the accessibility and market share of iodized packet salt with €˜two-child€™ logo;
  • Create awareness about the importance of use of iodized salt for the control of iodine deficiency disorders;
  • Explore the possibility of progress evaluation system in IDD control program on a rotational basis in all 5 development regions;
  • Expand iodized salt social marketing campaign in EDR & CDR.

1.4.3    Control of Vitamin A Deficiency (VAD)

  • Distribute high-dose vitamin A capsules to children between 6 and 59 months biannually through FCHVs;
  • Advocate for increased home production, consumption and preservation of Vitamin A rich foods at the community level;
  • Explore the fortification of suitable foods (such as sugar and cooking oil) with Vitamin A;
  • Strengthen the usage of Vitamin A Treatment protocol;
  • Supplementation of Vitamin A capsule (200000 IU) to postpartum mothers through healthcare facilities and community volunteers;
  • Treatment of night-blind pregnant women with low dose Vitamin A capsule (25,000 IU) through healthcare facilities (in Sunsari, Chitwan and Parsa districts only);

1.4.4    Control of Iron Deficiency Anaemia (IDA) and Postnatal  

  • Increase the coverage and compliance of iron/ folate supplementation for pregnant women;
  • Reduce the burden of parasitic infestations (helminths, malaria and Kalazar);
  • Identify and implement food fortification to increase the dietary iron intake focusing on commercial as well as small-scale community based fortification initiatives;
  • Promote dietary diversification to improve the quality of food consumed with an emphasis on bio-available iron;
  • Promote maternal care practices and services to improve health and nutritional status of mother and babies;
  • Identify and implement  the effective modalities to address iron deficiency in young children, adolescents and non-pregnant women of reproductive age; 

1.4.5    Deworming

  • Distribute de-worming tablet to all children aged 1-5 years along with vitamin A capsule distribution;
  • De-worming of pregnant women through health facilities with single dose tablet (Albendazole 400 mg) starting from 2nd trimester (4 months) of the pregnancy;

Follow up the comprehensive deworming work plan.


Objectives of the Nutrition Program and Targets of Nutrition its numerator, and denominator

0

In this section of our Internship report, we are writing objectives of the Nutrition Program and Targets of Nutrition and list out main indicators, its numerator, and denominator

1.1 Objectives of the Nutrition Program

In order to improve the overall nutritional status of children and pregnant women, the national nutrition program has set the following objectives:

1.1.1  Control of Protein Energy Malnutrition

To reduce protein-energy malnutrition in children under three years of age through a multi-sectoral approach;

1.1.2  Control of Iodine Deficiency Disorders

To eliminate iodine deficiencies disorders by the year 2010;

1.1.3  Control of Vitamin A Deficiency Disorders

To eliminate vitamin A deficiency by the year 2010;

1.1.4  Control of Anaemia

To reduce the prevalence of anemia (including iron deficiency) by one third by the year 2010;

1.1.5 Low Birth Weight

To reduce the incidence of low birth-weight to 19 percent of all births by the year 2007;

1.1.6  Protection and Promotion of Breastfeeding

To promote exclusive breastfeeding until the age of six completed months. Thereafter, introduce complementary foods along with breast milk until the child completes 2 years or more.

1.2 Targets

1.2.1 Reduce severe and moderate malnutrition among children under three years of age at 40 percent by the year 2007;

1.2.2  Reduce iron deficiency anemia in pregnant women to 58 percent by the year 2007;

1.2.3  Reduce subclinical vitamin A deficiency among children under five years of age to 19 percent by preventive measures by the year 2007;

1.2.4  Reduce nutritional blindness caused by vitamin A deficiency among pregnant women to 3 percent by the year 20071.3 Indicators

Main IndicatorsNumerator and Denominator
1 Growth-monitoring coverageNumber of visits  x 100
Number of targeted visits
2 The proportion of malnourished children (weight for age)Number of children (0-36 months) under low growth curve for 1st visit  x 100
Number of children (0-36 months) new cases
3 Vitamin A mass distribution  coverageNumber of children (6-59 months) who received vitamin A capsules  x 100
Target Population (6-59 months)
4  Postpartum Vitamin A coverageNumber of Postpartum women supplemented with vitamin A capsule  x 100
Total number of Expected pregnancies
5 Iron distribution coverage (women)Number of pregnant women who receive at least some iron tablets x 100
Target population (expected pregnancies)
6 Deworming coverageNumber of children (1-5 years) receiving deworming tablets twice a year  x 100
Number of children of 1-5 years
7  Iodised salt coverageNumber of Households using adequately iodized salt (³15 ppm) x 100
Number of Households Surveyed
8 Urinary iodine excretion (UIE)³ 100 microgram iodine per liter of urine (Median)

 Calculated as follows: 1/3 x target population x 6 visits + 2/3 target pop. x 4 visits, where the target population is all children 0-36 months of age. This target cannot be monitored with HMIS data at the central level, but a sample survey of Nutrition Registers will provide this information.  Note: In FY 2061/62, the target for visits was to be 85 percent of children 0-36 months of age.

The target was 85 percent of expected pregnancy in FY 2061/62.

Nutrition Report, Malnutrition, background, Overall goal

0

Here we are showing you some of the nutrition reports from Nepal, malnutrition and how it is a serious obstacle to child survival and overall goal.

1 BACKGROUND

Malnutrition remains a serious obstacle to child survival, growth, and development in Nepal. The most common forms are protein-energy malnutrition (PEM) and micronutrient deficiency states (iodine, iron, and vitamin A deficiency).  Each type of malnutrition wrecks its own particular havoc on the human body, and to make matters worse, they often appear in combination.

There is wide variation in the state of malnutrition throughout Nepal, both ecologically and regionally. Stunting is more common in the mountain areas than in the Terai, but underweight and wasting are more common in the Terai area than in the mountain areas.  There are many causes of PEM.  An important cause of PEM in Nepal is low birth weight.  Low birth weight also leads to an intergenerational cycle of malnutrition.

Iodine deficiency disorder was another most endemic problem in Nepal, especially in the western mountains and mid-hills during the 1970s. To overcome this public health problem, Government of Nepal, Ministry of Health and Population adopted a policy in 1973 to fortify all edible common salt with iodine under the ‘Universal Salt Iodization (USI) Program’. Later in 1998, the Ministry of Health and Population issued a ‘two-child logo’ for quality certification of iodized packet salt with 50 ppm iodine at the production level.

Since fiscal year (2060/61), Child Health Division decided to celebrate February as the month to create general awareness about the use of iodized salt by conducting different activities with the help of different partner agencies like UNICEF, WHO and Salt Trading Corporation Ltd. This advocacy campaign is expected to further contribute to the prevention of Iodine Deficiency Disorders (IDD).

In order to assure proper usage and storage of iodized salt at the household level, the Child Health Division is also co-ordinating with the Curriculum Development Centre under the Ministry of Education to update the current curriculum on iodine.

Micronutrient Initiative (MI), in 2005 conducted the survey to track the progress towards elimination of IDD in Nepal. Two main indicators of the IDD- urinary iodine excretion and salt iodine at the household level were assessed in the survey. The survey also explored the knowledge, attitude and behavior patterns of consumers towards procurement and consumption of iodized salt in the country. This  survey has revealed improved iodine status in Nepal as the median Urinary Iodine Excretion (UIE) among school-aged children increased from 144 micrograms/liter in 1998 to 188 microgram/liter in 2005, both of the levels being over the minimum level designated by WHO to indicate the adequacy of iodine intake i.e. 100 microgram/liter. Nepal has however yet to achieve the goal of Universal Salt Iodization, which requires that at least 90% of households should be consuming adequately iodized salt.

Vitamin A deficiency still remains to be a public health problem among school-aged children and women. Rates of night blindness increase with age in both children and women. Furthermore, rates are higher in rural areas. Among preschool children, no cases of night blindness are reported in urban areas. The highest rate of night blindness is seen in the eastern and central Terai.

Low dose vitamin A program has been piloted in Sunsari, Parsa and Chitawan to treat night blind pregnant women with 25000 IU vitamin A capsule, 4 weekly doses.

The prevalence of worm infestation in Nepal is very high. Worm infestation in children leads to decreased resistance to infection, induces malnutrition, and also, leads to anemia and also impairs cognitive function in children.

The deworming impact survey conducted in 2003/04 noted that children below the age of 2 years also are severely affected by worm infestation. Because of this and in accordance with recent WHO recommendation, the MoHP in 2004 lowered the age limit for deworming from one year to five years of age.  Therefore deworming of one to five years of age into the National biannual vitamin A supplementation is implemented in the entire country.

Similarly, de-worming of all pregnant women with a single dose of albendazole tablet after the first trimester of pregnancy in order to prevent anemia in them is being routinely practiced through all health facilities in Nepal.

Anemia caused by iron deficiency is a major public health problem in Nepal affecting all segments of the population. The prevalence of anemia was higher in preschool children (78 percent) than in pregnant women (75 percent). Moreover, astonishingly high rate of 90 percent was found in infants 6-11 months old (NMSS, 1998).

Recognizing the severe consequences of iron deficiency anemia, and its effects on health, learning capacity, productivity, and maternal and neonatal survival, Ministry of Health and Population has approved a five year Anemia Control Plan of action developed by Child Health Division, DoHS.

Iron supplementation during pregnancy has been a key health initiative in Nepal since 1980. According to the government policy, all pregnant women are supplied with an iron tablet containing 60 mg. of elemental iron, free of cost. It is provided to all pregnant women since the beginning of the second trimester of pregnancy and continued up to 45 days postpartum (225 days in total).

In order to increase coverage and compliance of iron tablets among pregnant and postnatal mothers, the Nutrition Section of the Child Health Division has been implementing the Intensification of Maternal and Neonatal Micronutrient Program (IMNMP)™ since 206061. IMNMP is operated through the existing health facilities as well as through community-based outlets like FCHVs. IMNMP is an integrated approach as it includes the promotion of antenatal check-ups, deworming during pregnancy, consumption of adequately iodized salt, postpartum vitamin A supplementation, promotion of nutritious foods and rest during pregnancy.

Phase one of IMNMP was launched in five priority districts in 2003 with support from MI. Nepali Technical Assistance Group (NTAG) was entrusted with the task of providing initial training and logistics support. Evaluation of the program has revealed a significant increase in coverage and compliance of iron tablet supplementation among pregnant and postpartum women. As for example, coverage among third trimester pregnant women rose from 47 percent at baseline at 2003 to 85 percent in 2005. Similarly, compliance increased from 28 percent at baseline to 73 percent by the end of the second year.

These achievements have resulted in the phase-wise expansion of this program to 22 districts by July 2006. The MI, UNICEF and other organizations are replicating the program in additional districts in the year 2006/2007. The DoHS has planned nationwide program implementation by on 2009-10.

Food fortification with iron is a low-cost intervention for providing iron-rich nutrients to a larger population without changing their food consumption patterns. In Nepal, the most appropriate fortification vehicle to reduce iron deficiency anemia is wheat flour.  Fortification is now underway at few flour mills.

Realizing a need for a comprehensive document on nutrition policy and strategy for generating support and effective implementation of the program, A National Nutrition Policy and Strategy was compiled and approved in a single document form in FY 2061/62. During the development of this document, several new areas like household food security, improved dietary habit, life cycle-related diseases, school health and nutrition, nutrition in exceptionally difficult circumstances and analyzing, monitoring and evaluation of nutrition situation for future activity were also identified.

School-aged children, especially in the government-run schools are also one of the vulnerable groups to suffer from PEM problems. This leads to an undernutrition situation in them and thus they suffer from PEM, vitamin ‘A’ deficiency and iron deficiency anemia. To address these issue, a ‘National School Health and Nutrition Strategy’ has also been approved by MoHP as an integral part of the comprehensive National Nutrition Policy and Strategy.

Overall goal:

Achieving nutritional well being of all people in Nepal so that they can maintain a healthy life and contribute to the socio-economic development of the country in collaboration with relevant sectors.

Achieving nutritional well being of all people in Nepal so that they can maintain a healthy life and contribute to the socio-economic development of the country in collaboration with relevant sectors.

EPI and MMS Expanded Programme on Immunisation, report, assignment

0

EPI program is to reduce child morbidity, mortality, and disability associated with vaccine-preventable diseases, MMS as MiniMicroSpheres with Delivery of Services, its Indicators, analysis, and report of achievements.

Expanded Programme on Immunisation

Background:

The National Immunisation Programme (NIP) is a high priority program (P1) of the Government of Nepal.  Immunization is considered as one of the most cost-effective health interventions.  Effective implementation of the Immunization program is considered to contribute directly to the reduction of infant, child morbidity and mortality and ultimately will contribute to achieving millennium development goal.

Vaccine-preventable diseases (VPDs) are routinely reported through the HMIS and outbreak response complemented by active integrated surveillance of AFP with the support of Immunization Preventable Diseases/WHO. This includes surveillance of Measles, NT and Japanese Encephalitis.

The National immunization program covers all the 75 districts of the country. It is striving hard to have uniform high coverage in all the districts and sustain it (i.e. at least 90 percent for BCG, OPV3, DPT-Hepatitis B3, and measles vaccine in children under one year of age and 80 percent for TT2+ in pregnant women).  There are still pockets of low coverage VDCs and districts. Due to weak immunization structure coverage is low in most of the municipalities.

1.1 GOAL

The overall goal of the EPI program is to reduce child morbidity, mortality, and disability associated with vaccine-preventable diseases.

1.2 Objectives

1.2.1  Achieve and sustain immunization coverage of >90 percent in National level with >80 percent in all districts and below for all antigens.

1.2.2 Maintain a polio-free status.

1.2.3 Eliminate maternal and neonatal tetanus by 2005 and sustain the status.

1.2.4 Reduce measles mortality by 50 percent from 2003 levels and sustain the achievement.

1.2.5 Integrate the surveillance of additional VPDs into the existing surveillance system.

1.2.6 Strengthen and sustain the vaccine and logistics management system.

1.2.7 Introduce new and underused vaccines into the National Immunization Program on the basis of disease burden.

1.3 Targets

1.3.1  All infants (under one year – 12 months) for BCG, DPT-HepB, OPV, and Measles vaccines

1.3.2  All pregnant women for TT2+ vaccine

1.3.3  All 1, 2 and 3-grade students for School Immunization Programme.

The table below provides a schedule for immunizations at different ages.

Immunization Schedule

Immunization Schedule
Type of VaccineNumber of DosesRecommended Age
BCG1At birth or on the first contact
OPV36, 10, and 14 weeks of age
DPT – Hep B36, 10, and 14 weeks of age
Measles19 months of age
TT2Pregnant women
JE1Under discussion

NIP under Child Health Division has a lead role in all immunization-related activities at the National level including coordinated actions with other Divisions of the DoHS and all other partners. The Regional Health Directorate (RHD) acts as a facilitator between the Central and the District levels.  It is the responsibility of the D(P)HO to ensure that a successful immunization program is implemented at the district level.  Primary Health Centers (PHCs), Health Posts (HPs), and Sub-Health Posts (SHPs) implement immunization programs in their Village Development Committees (VDCs)

Delivery of Services

NIP delivers the Immunization services through Routine and Supplemental Immunization Programs

  1. Routine Immunization

The National Immunization Program delivers routine immunization through fixed health facilities, outreach programs, and mobile teams.

  • Fixed facilities: Immunization services are provided at hospitals, primary healthcare centers, health posts, and sub-health posts.  Some health facilities equipped with refrigerators provide immunizations daily and some provide weekly.
  • Outreach services: Provide access to the people who have difficulty in reaching health facilities due to long distance to travel, three to five immunization sessions a month are conducted at several locations in each VDC. The frequency of outreach services is based on village setting, population density, and seasonal variations. These sessions account for more than 90 percent of immunization coverage.
  • Mobile teams:  Geographical conditions such as lack of roads and bridges hamper immunization in remote areas. Due to vacant or frequent absenteeism of health worker in remote areas, there is poor access of target population to routine immunization. These areas are identified and appropriate strategy are developed during micro-planning.  To address these issues, at least four visits to identified hard-to-reach areas by vaccinators are mandatory through mobile teams to immunize targeted population.

Though the immunization service is mainly delivered through government health network, there is an increasing trend of immunization service delivery through the private sector. This is due to the realization of Public-Private Partnership in Health Sector Reform Strategies of government. In the private sector, immunization services are delivered through private clinics, hospitals, nursing homes as well as NGOs. Government supplies all vaccines and immunization related logistics to these private institutions free of cost. All vaccine under the National Immunization Program are given free of cost or there is no cost-sharing / recovery.

1.4 Indicators

The indicators used for National Immunization program monitoring are as follows:

Main IndicatorsNumerator and Denominator
1  Immunization coverageNumber of children under one year of age immunized with a specific dose of antigen
Total estimated number of children under one year of age
2 Immunization coverage for TT2+ vaccineNumber of pregnant women immunized with TT2+
Total estimated number of pregnant women
3 DPT-Hep-B drop-out rates   (DPT-HepB1 vs. DPT-HepB3) Number of children received DPT-HepB1 – Number of children received DPT-HepB3
Number of children received DPT-HepB1
5 Measles drop-out rates (BCG vs. Measles vaccine)Number of children received BCG – Number of children received Measles vaccine
Number of children received BCG
6  Vaccine Wastage RateNumber of vaccine doses received – Number of vaccine doses used
Number of vaccine doses received
7 Immunization SessionNumber of Immunization Session conducted in a year
Number of total immunization session planed in a year
8  AFP SurveillanceAt least 2 AFP cases in 100,000 population per year
9. NT SurveillanceNo or less than one NT case in 1,000 live birth per year per district

For the purpose of monitoring of the EPI activities wastage rate and morbidity due to vaccine-preventable diseases is also taken into consideration.

1.5  Strategies

The strategies to achieve the above objectives are:

1.5.1  Provide immunization services through all health facility, EPI outreach sessions; Mobile Clinics

1.5.2 Conduct supplemental immunization activities for:

– Polio eradication

– Measles and JE control

1.5.3 Expansion of School Immunization Program to sustain MNT elimination

1.5.4 Strengthen monitoring system of Immunization Program:

  • VDCs wise data analysis, categorization, and prioritization for action at districts level
  • Use of immunization monitoring chart
  • Review of Immunization Program at a different level and feedback

1.5.5 Conduct districts level Micro-planning

1.5.6  Strengthen and expand integrated surveillance of VPDs built on AFP Surveillance (AFP, Measles, Neonatal Tetanus and Japanese encephalitis) and initiation of the study of the disease burden of other vaccine-preventable diseases like Hib and Rubella.

1.5.7 Control outbreak of VPDs through appropriate interventions;

1.5.8 Increase and promote public awareness and demand through social mobilization for immunization services and IEC/BCC interventions.

1.5.9  Strengthening of cold chain capacity in all 75 districts and ensure their functioning

1.5.10  Training to Health Workers (Mid Level Manager and Cold Chain Assistant)

1.5.11  Strengthening and expansion of AEFI surveillance

1.5.12  Strengthen supportive supervision

2  ANALYSIS OF ACHIEVEMENTS BY MAJOR ACTIVITIES

2.1       Major Activities Carried Out in FY 2062/63 (2005/2006)

The following were the major activities carried out during FY 2062/63

2.1.1       Conduction of immunization services through three to five outreach immunization sessions per Village Development Committee (VDC) per month;

2.1.2       Continuation of immunization services through health facility-based clinics located at the hospitals, PHCCs, HPs and SHPs;

2.1.3       Provided training on immunization for various levels of health workers (Mid Level Manager and Cold Chain Assistant training).

2.1.4       Expanded and continued integrated VPDs Surveillance (AFP, Measles, and NT) including JE Surveillance.

2.1.5       Initiated Hib diseases burden study

2.1.6       Conducted Responsive Mopping-up activity in 5 Terai districts of Nepal

2.1.7       Conducted Sub-National Immunization Days (SNID) for Polio Eradication Initiatives in 21 high-risk districts of Nepal (bordering with India).

2.1.8       Established Polio static booths (131 booths) on bordering districts with Bihar and UP of India in response to the supplementary immunization activities.

2.1.9       Completed districts micro-planning in 20 districts

2.1.10   Conducted performance review of immunization program at a different level

2.1.11   Developed a multi-year plan of action (2007-2011)

2.1.12   Implemented of School Immunization Activities in 8 districts

2.1.13   Developed and print Immunization Atlas of Nepal.

2.1.14   Revised, Printed and Distributed Immunization Monitoring Chart

2.1.15   Completed JE Vaccination Campaign in 6 hyperendemic districts

2.1.16   Districts NIP performance was verified through Data Quality Self Assessment in 10 districts

2.2       TARGET vs. ACHIEVEMENT, FY 2062/63 (2005/2006)

During FY 2062/63, the EPI target was to cover 90 percent of under-one-year children. However, the achievement shows that the BCG coverage was 96.1 percent, DPT3 93.0 percent, OPV3 91.9 percent and Measles 87.5 percent.  Overall coverage for all the vaccines increased in this FY compared to previous fiscal year 2061/62.

SNActivitiesUnitTargetsAchievementTarget vs. Achievement (percent)
1BCG vaccinationInfants742,164713,08696.1
2DPT1 vaccinationInfants742,164690,49693.0
3DPT2 vaccinationInfants742,164681,00691.8
4DPT3 vaccinationInfants742,164690,29893.0
5Hepatitis B I vaccinationInfants742,164655,77488.4
6Hepatitis B II vaccinationInfants742,164653,12288.0
7Hepatitis B III vaccinationInfants742,164661,58489.1
8Polio1 vaccinationInfants742,164684,05392.2
9Polio2 vaccinationInfants742,164675,05991.0
10Polio3 vaccinationInfants742,164682,40191.9
11Measles vaccinationInfants742,164649,39087.5
12TT2 vaccinationPregnant women941,890482,84151.3
13Polio Responsive Mopping-up activity €“ I RoundUnder 5 yrs Children475,617471,46099.1
14Polio Responsive Mopping-up activity €“ II RoundUnder 5 yrs Children475,617476,586100.2
15Polio Responsive Mopping-up activity €“ III RoundUnder 5 yrs Children475,617482,922101.5
16Polio SNID in 15 Districts €“ I RoundUnder 5 yrs Children1,796,7601,756,42297.8
17Polio SNID in 15 Districts €“ II RoundUnder 5 yrs Children1,796,7601,770,45398.5
18Polio SNID in 6 Districts €“ I RoundUnder 5 yrs Children597,683554,45292.8
19Polio SNID in 6 Districts €“ II RoundUnder 5 yrs Children597,683546,95191.5

Source: HMIS/MD and EPI/CHD, DoHS

Analysis of the reports from all 75 districts of the country for FY 2062/63 shows that overall coverage level for BCG vaccination is 96.1 percent, measles vaccination is 87.5 percent, DPT3 93.0 percent, OPV3 91.9 percent and Tetanus Toxoid (TT2) is 51.3 percent.  However, coverage for all antigens are not uniform among the districts and within the VDCs of the districts, some of the districts achieving more than 100 percent coverage, and others are far behind.

2.3       ANALYSIS OF SERVICE STATISTICS

The table 2a.1 and figure 2a.1 present the annual immunization coverage of BCG, DPT, OPV, and measles vaccine in Nepal from FY 2060/61 to 2062/63.  The figures are expressed in percentage of the targeted population for each fiscal year.  It has been observed that the coverage of all antigens increased in FY 2062/63 compared to FY 2061/62.

Table 2a.1       Annual Immunisation Coverage in Nepal, FY 2060/61 to 2062/63

YearBCGDPT3OPV3Measles
2060/61            2003/200496.3%90.3%90.2%85.4%
2061/62            2004/200592.4%80.0%83.0%79.3%
2062/63          2005/200696.1%93.0%91.9%87.5%

Source: HMIS/MD, DoHS

Based on DPT3 coverage and DPT1 vs. DPT3 dropout rates, categorizations of the districts as per their performance are shown in the District Categorized table.  Districts under category 4, 3 and 2 respectively are the most concerned for NIP to address their access and utilization problem. Activities carried out to address the problems were to revise immunization session through micro-planning, to trace missed children for successive doses, to mobilize FCHVs and involve community leaders. Districts under category 1 were continuously monitored for sustaining their achievements.

Table 2a.2       Immunisation Coverage (Percent), by Region, FY 2060/61 to 2062/63

IndicatorsYearRegionNational   Total
EDRCDRWDRMWDRFWDR
BCG (<1 year)   Coverage 2060/61      2003/0497.3106.188.592.985.096.3
2061/62      2004/0594.3102.586.186.379.792.4
2062/63      2005/0697.3103.587.696.986.796.1
DPT3 (<1 year)   Coverage 2060/61      2003/0494.097.585.585.377.590.3
2061/62      2004/0582.683.280.973.872.880.0
2062/63      2005/0695.898.084.496.184.893.0
Polio3 (<1 year)   Coverage 2060/61      2003/0493.597.785.485.877.390.2
2061/62      2004/0587.987.181.077.273.483.0
2062/63      2005/0694.596.184.495.384.591.9
Measles (<1 year)   Coverage 2060/61      2003/0487.789.981.584.576.485.4
2061/62      2004/0584.481.277.476.371.279.3
2062/63      2005/0689.691.180.091.681.187.5
TT2 Coverage   (Pregnant women) 2060/61      2003/0445.844.240.036.839.942.3
2061/62      2004/0550.945.043.141.039.144.9
2062/63      2004/0556.449.449.252.348.151.3

Source: HMIS/MD, DoHS

Figure 2a.2 shows the trend in coverage of Measles vaccine for last 3 FYs. The coverage has increased in all the regions in FY 2062/63 with highest coverage (91.6 percent) being in MWDR and lowest (80.0 percent) in WDR. The national coverage of Measles vaccination is increased by 8.2 percent in FY 2062/63 as compared to FY 2061/62.

Figure 2a.4 shows the DPT1 vs. DPT3 dropout rate by region.  The drop out rate stands between -2.1 to 1.6 percent in FY 2062/63 with the highest rate in CDR (1.6 percent) and lowest in EDR (-2.1 percent). The national figure for the DPT1 vs DPT3 dropout rate stands at 0.0 percent in the FY 2062/63, which is a significant achievement of the NIP program of Nepal. As shown in figure 2a.3, the national coverage for TT2 vaccination in pregnant women was 44.9 percent in 2061/62. However, in FY 2062/63 the TT2 coverage increased by 6.4 percent points at the National level (51.3 percent). The percentage of pregnant women immunized with TT2 vaccine increased in all the region in the FY 2062/63.  The coverage was highest in EDR (56.4 percent) and lowest in FWDR (48.1 percent).

The Vaccine Wastage Rate (figure 2a.6) of all antigens has been observed as follows in FY 2062/63: BCG 74.8 percent, DPT 21.3 percent, Polio 24.7 percent and Measles 59.4 percent. The wastage rate of vaccines, especially BCG & Measles compared to normally accepted rate is still a challenge. Figure 2a.5 shows the BCG vs. Measles dropout rate. It has decreased from 14.2 percent in FY 2061/62 to 8.9 percent in FY 2062/63 at National level.  The highest dropout rate was observed in the CDR with 12.0 percent and lowest in MWDR 5.5 percent.  There is a trend of improvement in the dropout rate in general.

According to figure 2a.7, the lowest number of BCG vaccination was observed during the month of Chaitra.  The month-wise BCG vaccination trend is seen to be considerably better in FY 2062/63 compared to FY 2060/61 and FY 2061/62.

2.4.1    National Immunisation Days (NIDs) for Polio Eradication2.4       SUPPLEMENTARY IMMunization activities

To eradicate poliomyelitis, EPI continued to implement a program of “Intensified National Immunization Days” (INID) in two rounds from 2053/54 to FY 2060/61.  In the first year NIDs were conducted successfully in two rounds in 2053/54 (on 6 December 1996 and 17 January 1997).  Consecutively every year two rounds of NIDs were being conducted.  Besides, Sub-National Immunization Days, Pre-emptive Mopping-up and Responsive Mopping-up Activities in high-risk districts mainly districts bordering with India and Kathmandu Valley were also conducted.  Intensified National Immunisation Days were not implemented during FY 2061/62 and 2062/63.

Nepal has not detected any poliomyelitis case caused by wild poliovirus for the last four years (the year 2001 to 2004) most probably because of high NID coverage of around 100 percent (see above figures). But in the FY 2061/62, four polio cases were detected in Sarlahi and Rautahat district which were imported from India one polio case was detected in 2062/2063 in Dailekh district of Nepal. Acute Flaccid Paralysis (AFP) Surveillance, is becoming a major activity in the eradication of polio from the country. Nepal has expanded active surveillance of polio to neonatal tetanus and measles from FY 2060/61 through the AFP-surveillance site and in FY 2061/62 JE surveillance was also integrated with VPDs surveillance.

2.4.2    Measles Campaign to Control Measles in Nepal

It was estimated that every year some 150,000 children are infected with measles and some 2,700 die due to its consequences. To prevent this huge amount of deaths and measles cases, Nepal conducted a successful campaign throughout the Kingdom aiming to reduce 50 percent of child mortality due to measles complications.  The success of this campaign created history in the field of public health by immunizing about 10 million children. The Measles Campaign was conducted in a phase-wise manner and the coverage of measles through the campaign was very satisfactory in the year 2004 and 2005.  Good social mobilization, active local participation, and assistance from various partner agencies contributed to the success of NIDs, Measles campaign and MNTE activities.  The result of this campaign is very encouraging in terms of reduction of measles outbreaks and children affected. However, to sustain this status is a challenge and to overcome this situation, initiatives like increasing coverage above and around 80 percent be reached through routine immunization strategies. Hence, RED strategies have been incorporated in the multi-year plan of action 2007-2011, which clearly states the activity to strengthen routine immunization.

Table Showing Effect of Measles Campaign:

Indicators200420052006
Measles outbreaks (Lab confirmed)     1381 
Children affected     6,05012 

Note: Data as of 05 December 2005 (through active surveillance)                                                                              Source: WHO/IPD

2.5       INTRODUCTION OF HEPATITIS B VACCINE

Introduction of Hepatitis B in the routine immunization program was done in all 75 districts by FY 2061/62.  From the FY 2062/63 DPT-HepB (Combo Vaccine) vaccine has replaced the DPT vaccine in all Districts of Nepal.

3          PROBLEMS/CONSTRAINTS AND ACTIONS TO BE TAKEN

Problems/ConstraintsAction was takenResponsibility
Denominator problem Local Health facility will generate their denominator using local resources like FCHVs and compare with given denominator. The district will validate the denominator of each health facility   HMIS, CHD, DHO and local health facility
Some of the newly supplied freezes and unfreezes to districts and sub-center are not functioning LMD, RMS with the assistance of CHD and partners will assess and fix the problem of freezes. LMD/CHD
The problem for regular cold chain maintenance   No trained manpower for repairing the nonfunctioning cold chain equipment at regional/ District level No contingency plan for cold chain   The technician at center, region, and CCA of the district should be trained for general maintenance of freezes. Preventive Maintenance Plan for the regular repair of cold chain equipment is prepared Manual for the repair of €œavailable freezes” be prepared and placed to DHO. Contingency Plan for cold chain management is prepared at Central, Regional and District cold room. CHD/ LMD/DHO
Delayed procurement of vaccine   Irregular and short supply vaccine Vaccine forecasting and procurement should be done timely. A standard POA will be developed and adopted for timely procurement of vaccines to avert shortfall of the vaccine. All level stores should have clear vaccine requirement and distribution plan and must ensure its implementation.   LMD/CHD
Some of the VHWs are old and disable, cannot conduct the EPI session. Districts should manage alternatives in the local context (MCHW/ VHW whoever is in place could run immunization) EPI session at health facility level should be conducted by health manpower available in HF (HFI, AHW, ANM, VHW, MCHW) CHD/ DHO and Health facility
Immunization in municipalities is weak No sanctioned post of VHW/MCHW at Municipality. No organized immunization service delivery structure. CHD and local development ministry will find out means to develop a model of immunization services of municipalities and will adopt timely. Develop a strategy to set up urban EPI clinics A detailed micro-planning involving municipalities, district health office, and all NGOs/INGOs should be conducted Districts can better utilize vaccinators through local NGOs INGOs for local management.  MoHP/ CHD/LMD.
Coverage to hard to reach the populationIDENTIFY THE UNDERSERVED or missed children   Use maps Aim for greatest numbers of un / partially -immunized children, not just low coverage rates Prioritize Ensure micro-plans are in place and work plans are being implemented Follow up and supervision The health facility, DHO/PHO/ CHD
There is no clear guideline to send HA, SAHW, Staff Nurse for EPI outreach clinics As per strategic guideline, HA/ AHW / staff nurse/ANM should conduct immunization session in the absence of VHWs /MCHWs. This should be addressed during micro-planning at the local level and managed at the district level. CHD/DoHS
Regular monitoring of immunization program using developed monitoring tools and quality information collection on immunization Timely, report collection will be reinforced and follow up will be done on immunization coverage drop out and surveillance of VPDs EPI supervisors and health facility in-charge should monitor and supervise to verify the information and avoid inconsistency. Health facility in-charge /District EPI Supervisors /DHO/DPHO
Injection safety in immunization   And AEFI surveillance Collection of injection sharp will be in safety boxes and disposal will be done by burning and buried at health facility level Low-cost incinerator construction at HF level will be encouraged below districts AEFI surveillance will be expanded from 31 sentinel sites to 51 sites. The health worker will be encouraged to report each and every AEFIs and investigate major one and use the result for improvement of the program   DHOs/ RHDs/ CHD
Social mobilization, community participation, and local ownership District level and health facility level performance, weakness and strength should be shared with community, NGOs, INGOs and plan to work together to achieve the target DHO and Local Health facility
Quality of review at a different level and micro-planning and data quality self-assessment Review of access and utilization of immunization services at Centre, region, district and health facility level, comparing with RCS, LQAS and DQSA findings. Micro planning at district headquarters or at the health facility level CHD/RHD, DHO and HF management committee.
Vaccine management at a different level is poor leading to irregularity in session conduction and increase in vaccine wastage Appropriate vaccine and logistic requirement and distribution plan at each level and ensure its implementation DHO/LMD/CHD
BCC activities to increase demand for immunization Community mobilization Involvement School teacher and student Use of electronic media NHEICC/ CHD
Weak supportive supervision Planned supervision with checklist and follow-up All levels
Training manuals need to be revised as per the present context Adaptation of immunization in practice in Nepali Health worker manual and cold chain manual needs to be revised CHD

4          TARGETS FOR FY 2063/64 (2006/2007)

S.N.ActivitiesUnitAnnual Targets
1Routine Immunisation activities aiming for higher coverageChildren <1 year747,567
2TT2+ Immunisation for all pregnant womenPregnant women961,241

Source:  EPI/CHD, DoHS

Note:    For detailed, district-specific data and analysis on this program/project, please refer to the relevant annexes in this document.

Example of Table of content for making health sector project

0

This is an example of the Table of content for making health sector project. While writing the report how we perform the internship this is one example for the health sector in the college.

Executive Summary. ……..1
Health Service Coverage Fact Sheet9
   
Introduction and Policy Background 
1aIntroduction ……11
1bNational Policies and Plans ……….13
  
Child Health 
2aExpanded Programme on Immunization ……..26
2bNutrition ………40
2cControl of Diarrhoeal Diseases………….54
2dControl of Acute Respiratory Infection ………66
  
Family Health 
3aFamily Planning ……..76
3bSafe Motherhood and Newborn Health …..92
3cFCHV Programme …….109
3dPrimary Health Care Outreach ………..115
3eDemography and RH Research…..121
  
Disease Control 
4aMalaria Control ……124
4bKala-azar Control……….131
4cJapanese Encephalitis…135
4dLymphatic Filariasis……139
4eTuberculosis Control…..142
4fLeprosy Control ….162
4gAIDS and STD Control.173
  
Curative Services 
5Out/In-Patient Care…….184
  
Supporting Programmes 
6aNational Health Training ….199
6bHealth Education, Information and Communication……..213
6cLogistics Management…225
6dCommunity Drug Program……………………………………………….233
6eLaboratory Services……239
6fAdministrative Management……………………………………………251
6gFinancial Management.255
6hManagement………………261
  
Development Partners 
7aMultilateral Partners……271
7bBilateral Partners…………285
7cInternational Non-Governmental Organisations……………..309
7dNational Non-Governmental Organisations…………………….339
  
Other Departments 
8aDepartment of Drug Administration………………………………..381
8bDepartment of Ayurveda…………………………………………………385
8cPashupati Homoeopathic Hospital………………………………….391
  
Annexure 
ITarget Populations and Health Facilities………………………….394
IIHealth Institution: Reporting Status………………………………..396
IIIRaw Data, Rates, and Ratios, by Programme, District, Ecological Zone,   Development Region and Hospital-based Data……………… 401
IVAcronyms……………………459

Child Health Programme

2a        Expanded Programme on Immunization…………….. 26

2b        Nutrition….. 40

2c        Control of Diarrhoeal Diseases…………………………. 54

2d        Control of Acute Respiratory Infection……………… 66

Family Health Programme

3a        Family Planning……………………………………………… 76

3b        Safe Motherhood and Newborn Health……………… 92

3c        FCHV Programme………………………………………… 109

3d        Primary Health Care Outreach………………………… 115

3e        Demography and RH Research……………………….. 121

Disease Control

4a        Malaria Control…………………………………………….. 124

4b        Kala-azar Control…………………………………………. 131

4c        Japanese Encephalitis Control………………………… 135

4d        Lymphatic Filariasis………………………………………. 139

4e        Tuberculosis Control…………………………………….. 142

4f         Leprosy Control……………………………………………. 162

4g        AIDS and STD Control………………………………….. 173

5          Out/In-Patient Care (including central hospitals)… 184

Supporting Programmes

6a        National Health Training………………………………… 199

6b        Health Education, Information and Communication………………………………………………… 213

6c        Logistics Management…………………………………… 225

6d        Community Drug Programme…………………………. 233

6e        Laboratory Services………………………………………. 239

6f         Administrative Management…………………………… 251

6g        Financial Management…………………………………… 255

6h        Management………………………………………………… 261

Development Partners

7a        Multilateral Partners

UNFPA….. 271

WHO…….. 275

The World Bank…………………………………………… 279

UNICEF…. 282

7b        Bilateral Partners

USAID…… 285

GTZ/HSSP 289

KfW……… 293

DFID…….. 297

SDC/RHDP………………………………………………….. 299

NFHP…….. 302

CECI……… 306

7c        International Non-Governmental Organisations

UMN…….. 309

Save the Children US…………………………………….. 316

MSI/SPN… 322

BNMT…… 328

INRUD….. 332

CEDPA….. 334

FHI……….. 337

7d        National Non-Governmental Organisations

FPAN…….. 339

Mothers Club……………………………………………….. 353

CRS Company……………………………………………… 356

Nepal Red Cross…………………………………………… 361

NTAG……. 364

NIIP………. 367

ADRA…… 371

CARE Nepal……….. 374

Other Departments

8a        Department of Drug Administration………………… 381

8b        Department of Ayurveda……………………………….. 385

8c        Pashupati Homoeopathic Hospital…………………… 391

Annexure

I           Target Population………………………………………….. 394

II          Health Institutions: Reporting Status………………… 396

III        Raw Data, Rate, and Ratio, by Programme, District, Ecological Zone,

Development Region and Hospital-based Data….. 401

IV        Acronyms. 459